Figure 5.
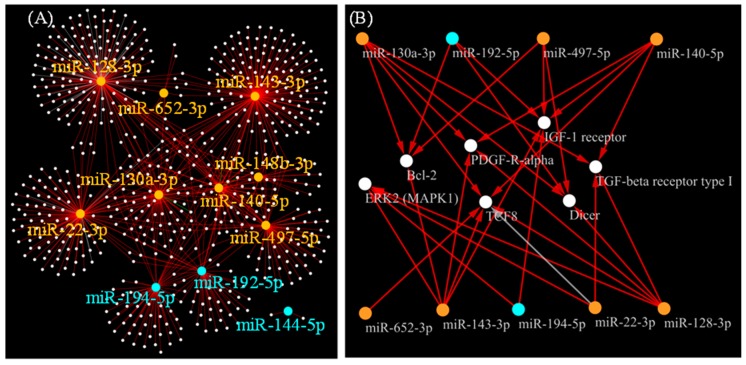
Network model representing miRNA-target gene relationship. (A) Network model representing miRNA-target gene interactions is presented, focusing on 11 miRNAs whose plasma levels showed correlations with both CHA2DS2-VASc score and CA operation, by referring to Metabase knowledgebase. White dots represent possible target genes. Orange and cyan dots represent miRNAs whose plasma levels showed positive and negative correlation with CHA2DS2-VASc score, respectively. Supporting literature information for the miRNA-target gene relationships is provided in Figure S1, and the network model file is provided as Figure S2; (B) Possible target genes that have ≥4 edges connected to either of the selected 11 miRNAs are presented. Orange and blue nodes indicate miRNAs whose plasma levels showed positive and negative correlations to CHA2DS2-VASc scores, respectively. Red and gray edges represent negative and unknown regulations of the miRNAs on their target genes, respectively.

