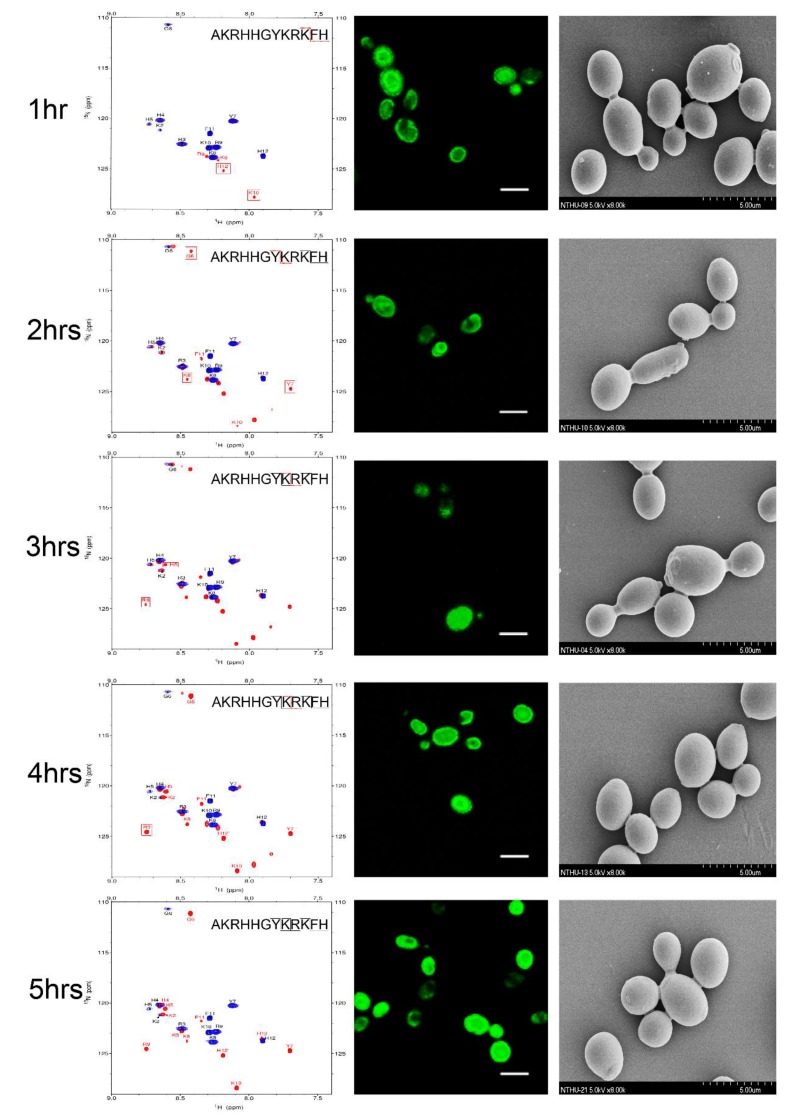
Figure 4.
Time-course analysis of 0.25 mM P-113 cleavage following interaction with 107 CFU/mL of C. albicans by HSQC spectroscopy (left panels), confocal laser microscopy (middle panels), and scanning electron microscopy (right panels). The bar corresponds to 5 μm. An overlay of 1H-15N HSQC spectra for 0.25 mM of P-113 in SD broth only (blue) and broth with C. albicans at 301 K at different time points (red) is shown. Perturbations of chemical shifts were observed over 5 h of incubation with C. albicans cells. Cell morphology did not change over the 5 h incubation period.

