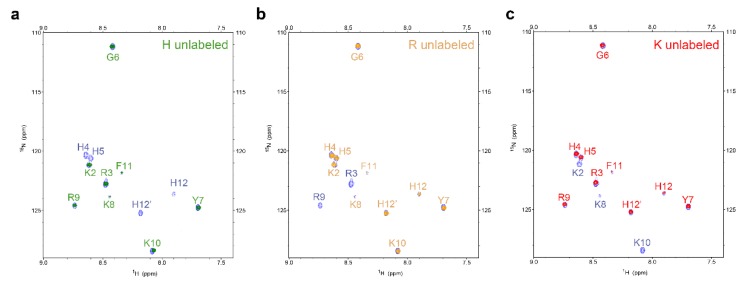
Figure 5.
1H-15N HSQC spectra for the different selectively unlabeled samples of P-113 treated with C. albicans at 301 K for 24 h. Blue peaks represent for uniformly 15N-labeled P-113: (a) green peaks for histidine selectively unlabeled P-113; (b) brown peaks for arginine selectively unlabeled P-113; (c) red peaks for lysine selectively unlabeled P-113.

