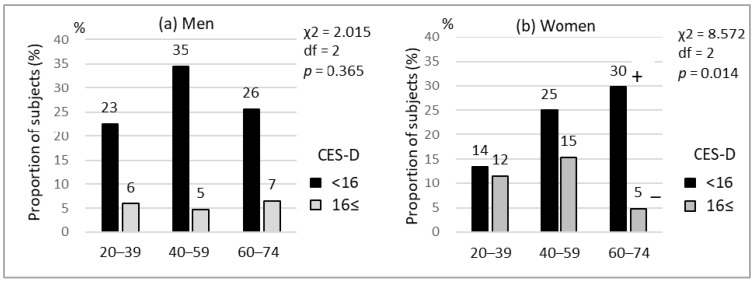
Figure 1.
The percentage of subjects with depressive symptoms in each age group: (a) Analysis of men; (b) Analysis of women. Three age groups (20–39, 40–59, and 60–74) were compared by the chi-square test and subsequently by post hoc adjusted residual analysis. +; adjusted residual >1.96, −; adjusted residual < −1.96.

