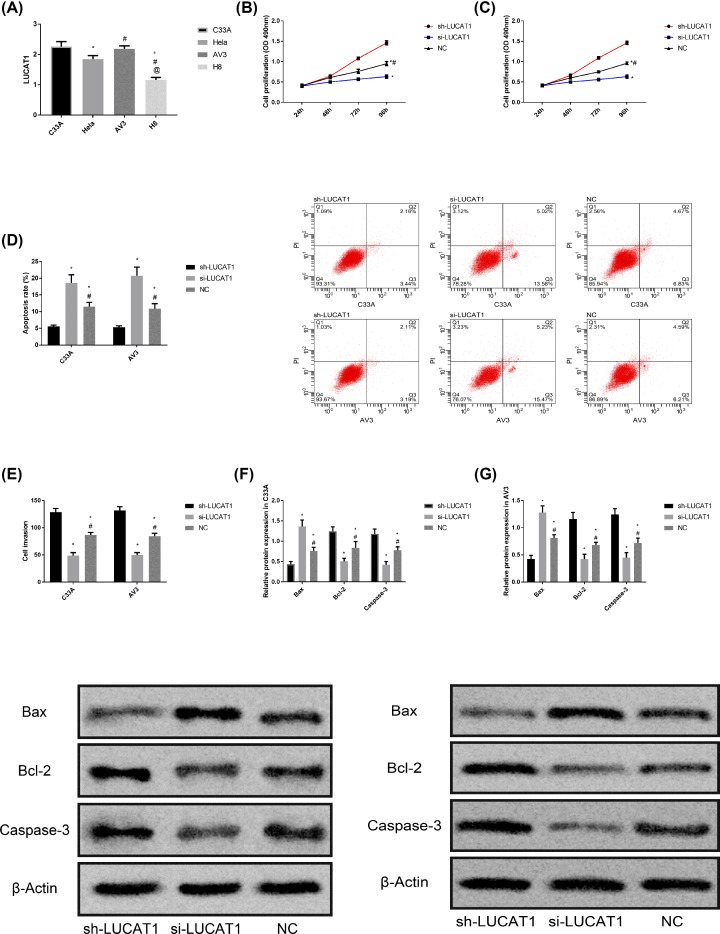
Figure 3. Effect of LUCAT1 on CC cells.
(A) Comparison of LUCAT1 expression levels in different CC cells, * represents comparison with C33A cells, P<0.050; # represents comparison with HeLa cells, P<0.050; @ represents comparison with AV3 cells, P<0.050. (B) Proliferation of C33A cells after transfection with LUCAT1. (C) Proliferation of AV3 cells after transfection with LUCAT1. (D) Apoptosis rate and flow cytometry of C33A and AV3 cells after transfection with LUCAT1. (E) Invasion ability of C33A and AV3 cells after transfection with LUCAT1. (F) Protein expression and protein imprinting map of C33A cells after transfection with LUCAT1. (G) Protein expression and protein imprinting map of AV3 cells after transfection with LUCAT1.

