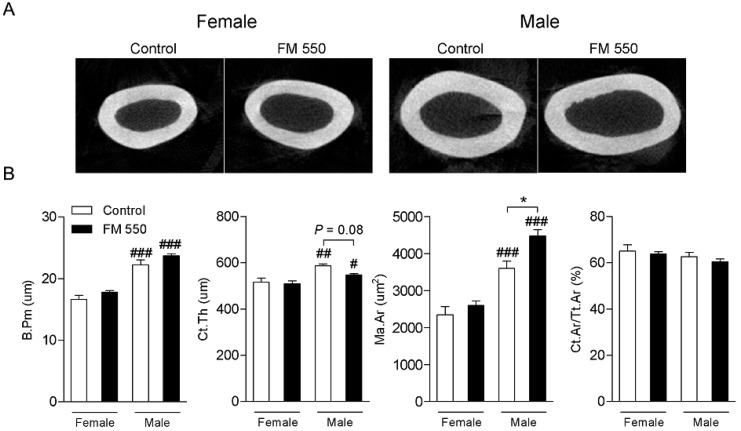
Figure 2.
Developmental effect of FM 550 on the femur cortical bone of female and male rats. (A) Representative microCT images of cross-sectional cortical bone female (left) and male (right) rats from Control and exposed to FM 550 groups. (B) Mean ± SEM of bone perimeter (B.Pm; µm), cortical thickness (Ct.Th; µm), cortical bone area/total tissue area (Ct.Ar/Tt.Ar; %), medullary area (Ma.Ar; µm2). Two-way ANOVA followed by the Holm-Sidak post hoc test (n = 4 per group). * p < 0.05 different from control of same sex, # p < 0.05 different from exposed females, ## p < 0.01 different from exposed females, ### p < 0.001 different from exposed females.

