Figure 3.
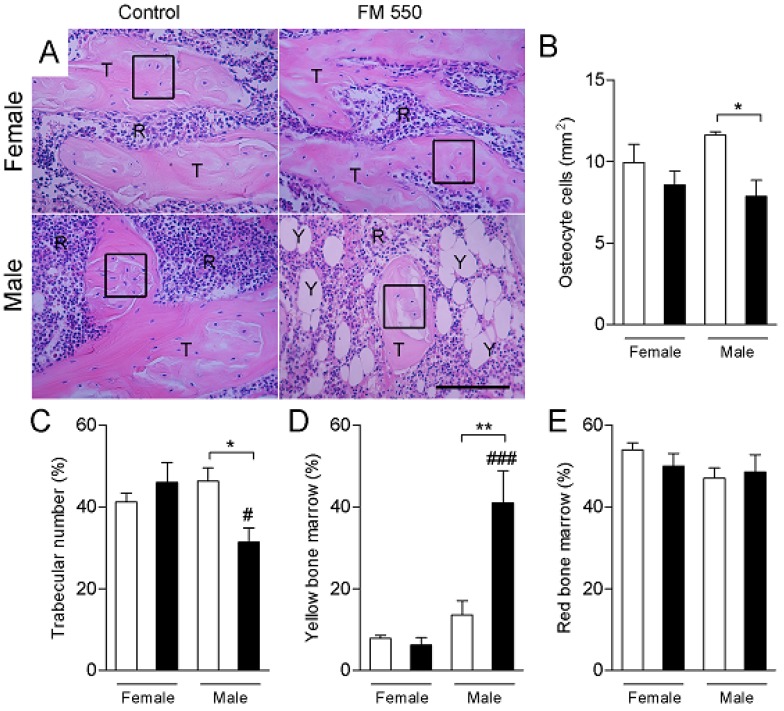
Developmental exposure to FM 550 attenuates bone cell differentiation in favor of adipocytes in male rats. Histomorphometric analysis of the femurs was performed using hematoxylin and eosin. (A) Representative images of hematoxylin and eosin staining in female (top) and male (bottom) rats exposed during development to FM 550. Black oblongs indicate the area of osteocytes count. T, trabecular bone. R, red bone marrow. Y, yellow bone marrow. Scale bar, 100 µm. Mean ± SEM number of osteocyte cell (B), percentage of trabecular bone (C), percentage of yellow bone marrow (D), and percentage of red bone marrow (E). Two-way ANOVA followed by the Holm–Sidak post hoc test. (n = 4 per group). * p < 0.05 different from control of the same sex, ** p < 0.01 different from control of the same sex, # p < 0.05 different from exposed females, ### p < 0.001 different from exposed females.

