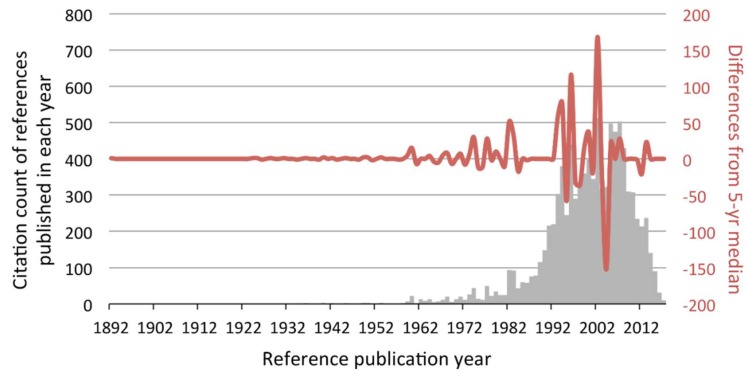
Figure 2.
Reference publication year spectroscopy (RPYS) based on the references made by the 280 papers. Each bar (grey) represented the total citation count received by all references published in that particular year. The line (red) shows the difference in the annual citation count from its 5-year median. Take the largest positive peak (year 2002) as an example. References published in years 2000, 2001, 2002, 2003, and 2004 received 397, 344, 512, 318, and 323 citations, respectively. The 5-year median was 344. As references published in year 2002 received 512 citations, the difference was +168 and hence formed a large positive peak.

