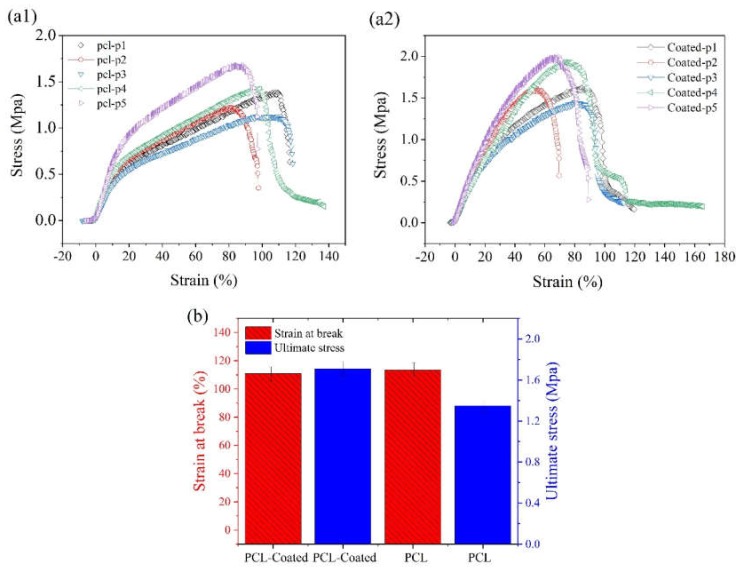
Figure 7.
(a1,a2) Stress–strain curves of (a1) pristine PCL membranes and (a2) collagen/chitosan-coated specimens; (b) Comparative histograms of ultimate stress and strain for pristine PCL (PCL-p1 to p5) and coated specimens (coated: p1–p5) (The comparison of data between the two groups (n = 5) using one-way ANOVA did not show any significant difference for p < 0.05.).

