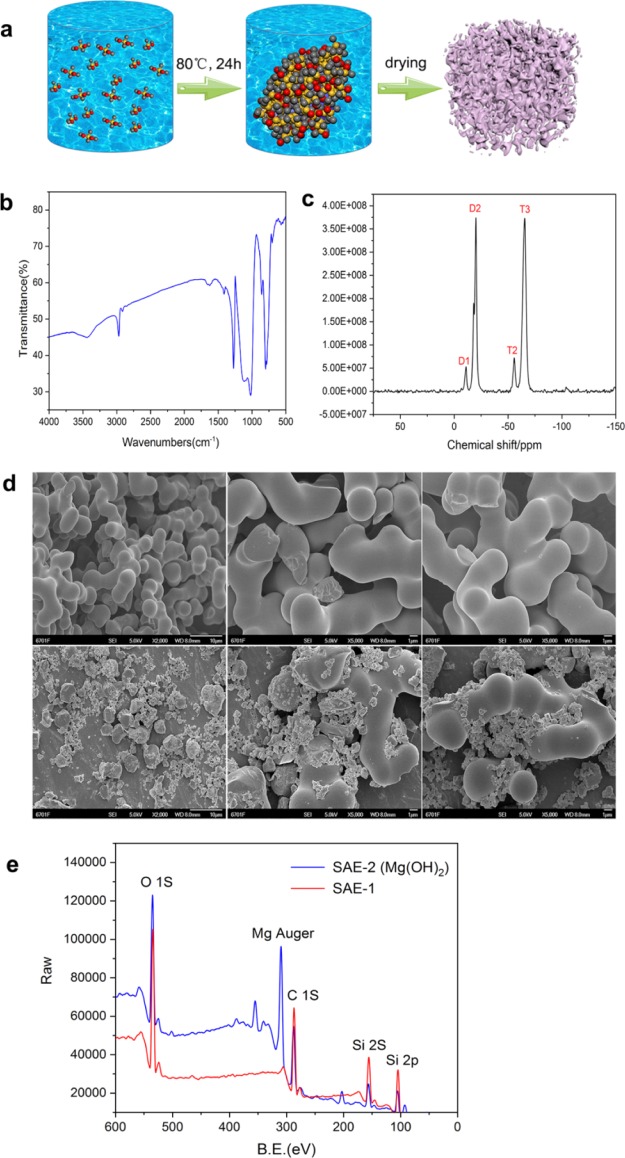
Figure 1.
(a) Schematic diagram of the synthesis of the SAE. (b) FTIR spectra of the SAE. (c) Solid-state 29Si NMR spectrum of the SAE. (d) SEM images of the unmodified SAE (above, scale bar: 10 μm for the left picture and 1 μm for the middle and right picture) and modified SAE (below, scale bar: 10 μm for the left picture and 1 μm for the middle and right picture). (e) XPS spectra of SAE-1 and Mg(OH)2-treated SAE-2.

