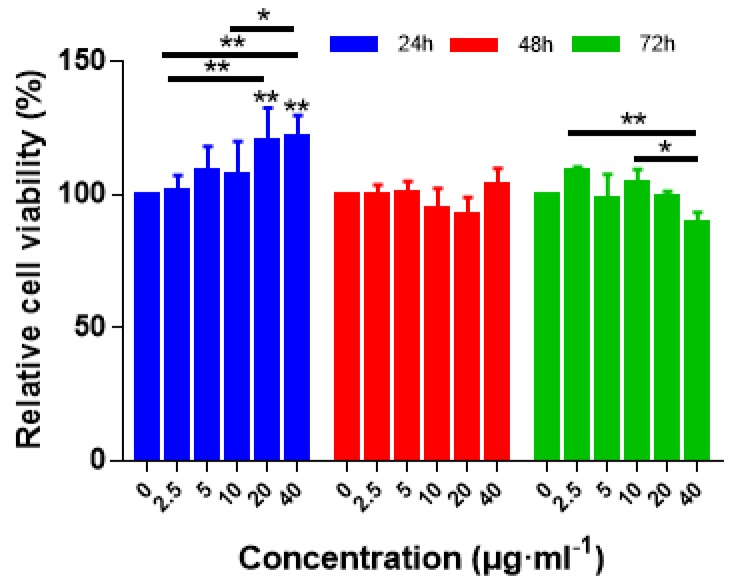
Figure 9.
Cell viability of RLTAs (R:T = 2:1) on the growth of the cartilage cells TC-28a2. The cells have been treated with one of three treating times with various concentration for 24, 48, or 72 h at concentrations of 2.5, 5, 10, 20, and 40 μg/mL. Results represent the means of three independent experiments and error bars represent the standard error of the mean. Statistical significance was assessed using two-way ANOVAs with Tukey’s multiple comparison tests (* p < 0.05, ** p < 0.01).

