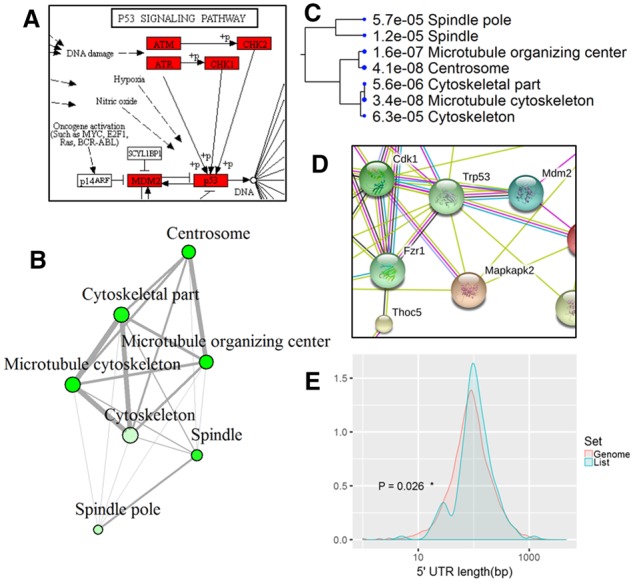
Fig. 1.

Example outputs of ShinyGO. (A) A partial KEGG pathway diagrams with genes highlighted. Enriched GO molecular component terms visualized as a network (B) and hierarchical clustering tree (C). (D) PPI network. (E) Distribution of the lengths of 5’ UTRs in query genes versus other coding genes in the genome
