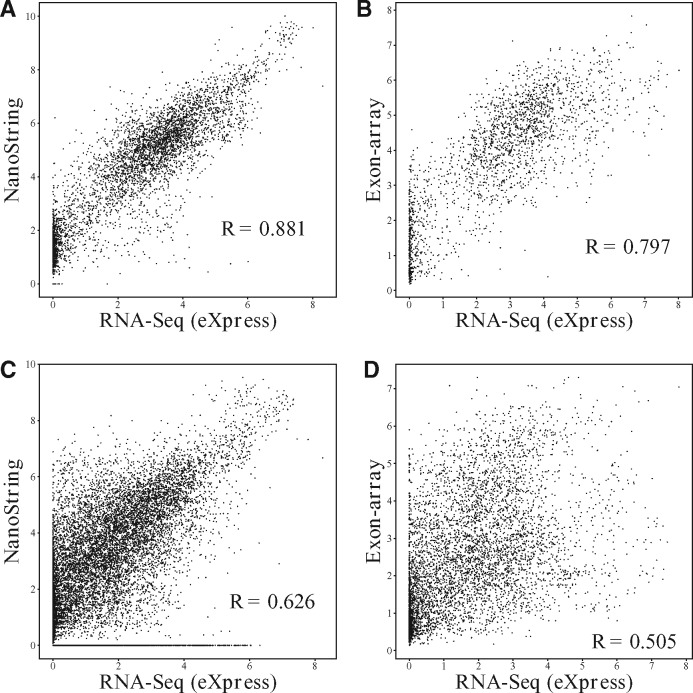
Fig. 1.
Scatter plots of gene expression and isoform expression estimated by RNA-Seq and other two platforms. (A and B) show the correlation of gene expressions between RNA-Seq and NanoString/Exon-array. (C and D) show the correlation of isoform expressions between RNA-Seq and NanoString/Exon-array. eXpress (Roberts and Pachter, 2013) with sequence-specific bias correction was applied for isoform/gene expression quantification with RNA-Seq data

