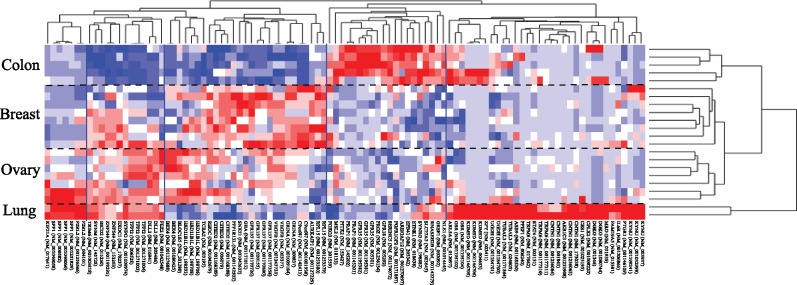
Fig. 2.
Cancer cell line clustering by 100 marker isoforms estimated by IntMTQ. The black dashed horizontal lines separate the clusters of cancer cell lines. The four clusters from top to bottom are colon, breast, ovarian and lung cancer cell lines. The solid vertical blue lines indicate the isoform clusters derived by hierarchical clustering. The official gene symbols with the RefSeq isoform names in the parentheses are listed at the bottom

