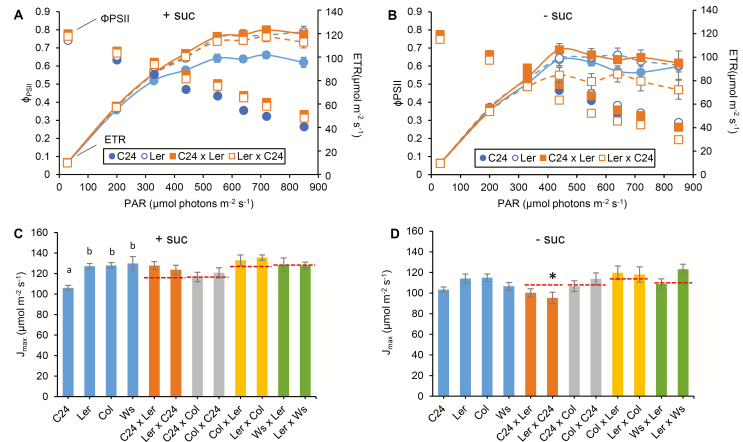
Fig. 1.
The light–response curves of the quantum yield of PSII (ϕ PSII) and the electron transport rate (ETR) of the 6 DAS C24×Ler hybrid seedlings grown on MS medium either (A) with or (B) without 3% sucrose. The chlorophyll fluorescence parameters were analysed and used to calculate ϕ PSII as described by Genty et al. (1989) using a pulse amplitude-modulated fluorometer (Closed FC 800-C, PSI). Each data point represents the average and SE of n≥5. The ETR was calculated by ETR=ϕ PSII×PAR×0.5×0.84, as described in Edwards and Baker (1993). (C and D) The maximum electron transport rates (Jmax) calculated by fitting the ETR curves of parental lines and hybrids grown either with or without sucrose to the C3 photosynthesis model. See Supplementary Fig. S1 for the chlorophyll fluorescence light–response curves of other hybrids used in this experiment. Statistical comparisons among parents are shown; datasets with different letters are significantly different from the others (ANOVA, P<0.05). Asterisks indicate a significant difference between the hybrid and the better parent (ANOVA, P<0.05). No significant differences were found between hybrids and the mid-parent value (indicated by red dashed lines) and between hybrids and the lower parent (ANOVA, P>0.05).

