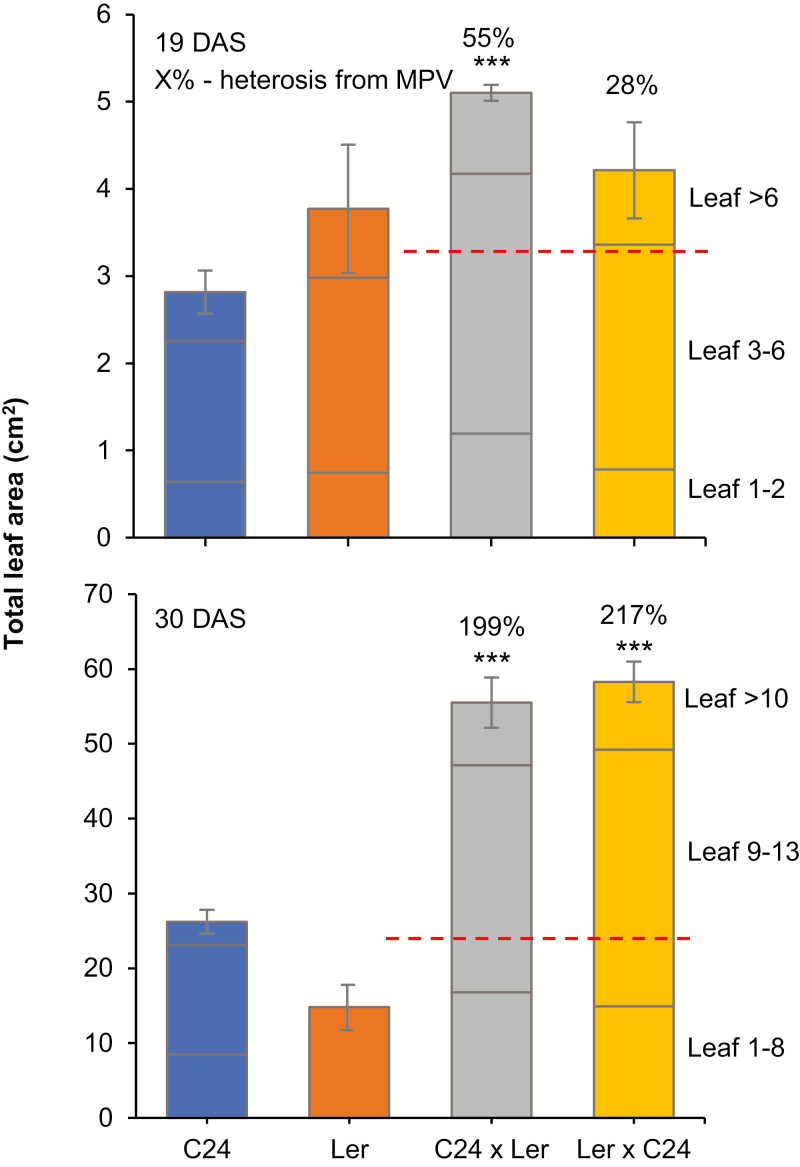
Fig. 7.
Relative contribution of leaf sets to the whole-plant biomass. Data presented are the average and SE of the sum of the leaf area per rosette, using the dataset from Fig. 6. Each data point was divided into three fractions: indicating the relative contribution of the largest leaves and the rest of the leaves in a seedling, in the order of their relative positions in a rosette. Percentages above columns represent the percentage of heterosis relative to the mid-parent value (red dashed lines). Asterisks indicate significant differences from the average level of the parents. *P<0.05, **P<0.001, ***P<0.001 (ANOVA). MPV, mid-parent value.

