
Fig. 3.
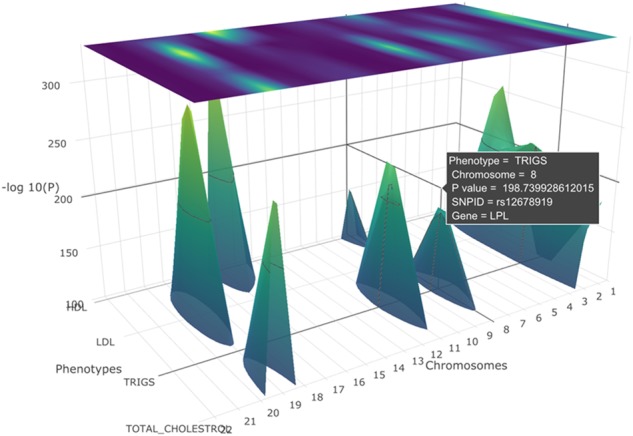
A PheGWAS plot for the phenotypes, SBP, DBP, HDL, triglycerides and cholesterol with a sectional view of −log10(p) >100 (entire genome level)
Official websites use .gov
A
.gov website belongs to an official
government organization in the United States.
Secure .gov websites use HTTPS
A lock (
) or https:// means you've safely
connected to the .gov website. Share sensitive
information only on official, secure websites.
A PheGWAS plot for the phenotypes, SBP, DBP, HDL, triglycerides and cholesterol with a sectional view of −log10(p) >100 (entire genome level)