
Fig. 6.
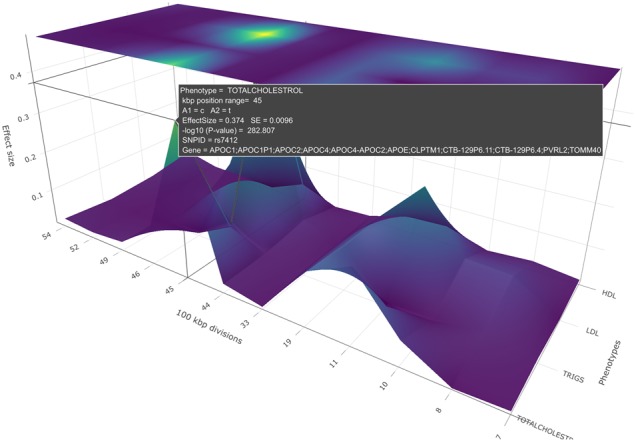
A PheGWAS effect size plot for the sectional view of a single chromosome (19th chromosome), produced by plotting the SNPs above a certain threshold of significant values of phenotypes, SBP, DBP, HDL, triglycerides and cholesterol
Official websites use .gov
A
.gov website belongs to an official
government organization in the United States.
Secure .gov websites use HTTPS
A lock (
) or https:// means you've safely
connected to the .gov website. Share sensitive
information only on official, secure websites.
A PheGWAS effect size plot for the sectional view of a single chromosome (19th chromosome), produced by plotting the SNPs above a certain threshold of significant values of phenotypes, SBP, DBP, HDL, triglycerides and cholesterol