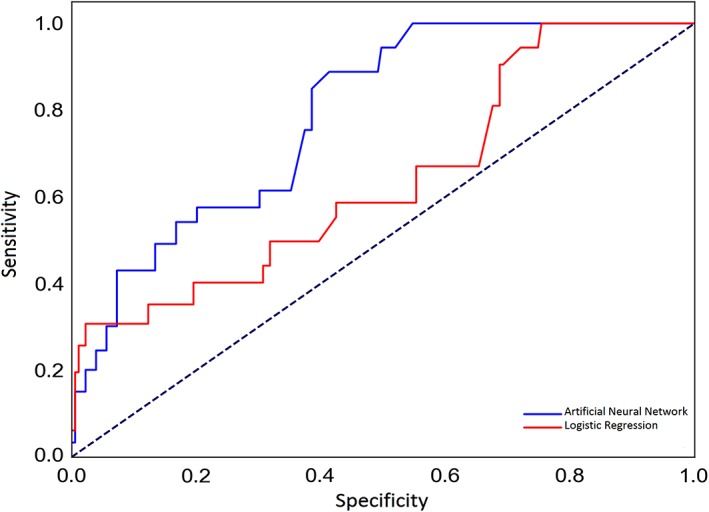
Figure 3.

The receiver operating characteristic (ROC) curves for prediction of vestibular schwannoma recurrence using the logistic regression (solid red line) and artificial neural network (solid blue line) models. Dotted line denotes to the reference line
