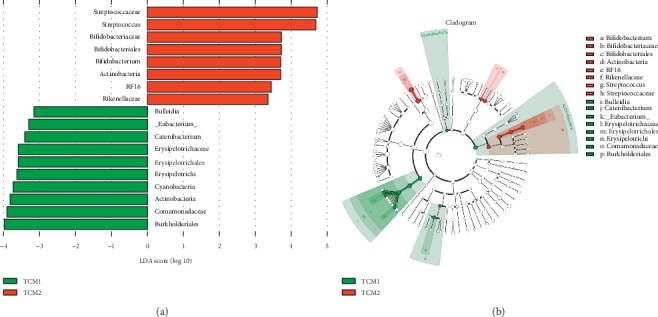
Figure 6.

Linear discriminant analysis effect size (LEFse) analysis on caecum microbiota. (a) Linear discriminant analysis (LDA): an LDA score higher than 2 indicated a higher relative abundance in the corresponding group than in the other two groups. (b) LEfSe taxonomy cladogram: different colors suggest enrichment of certain taxa in TCM1 (blue) and TCM2 (red). The size of the circles is based on relative abundance. The significantly different species using the nonparametric factorial Kruskal–Wallis rank sum test at a significance level of 0.05.
