
Figure 5. Relationship between ABR peak amplitudes for individual participants.
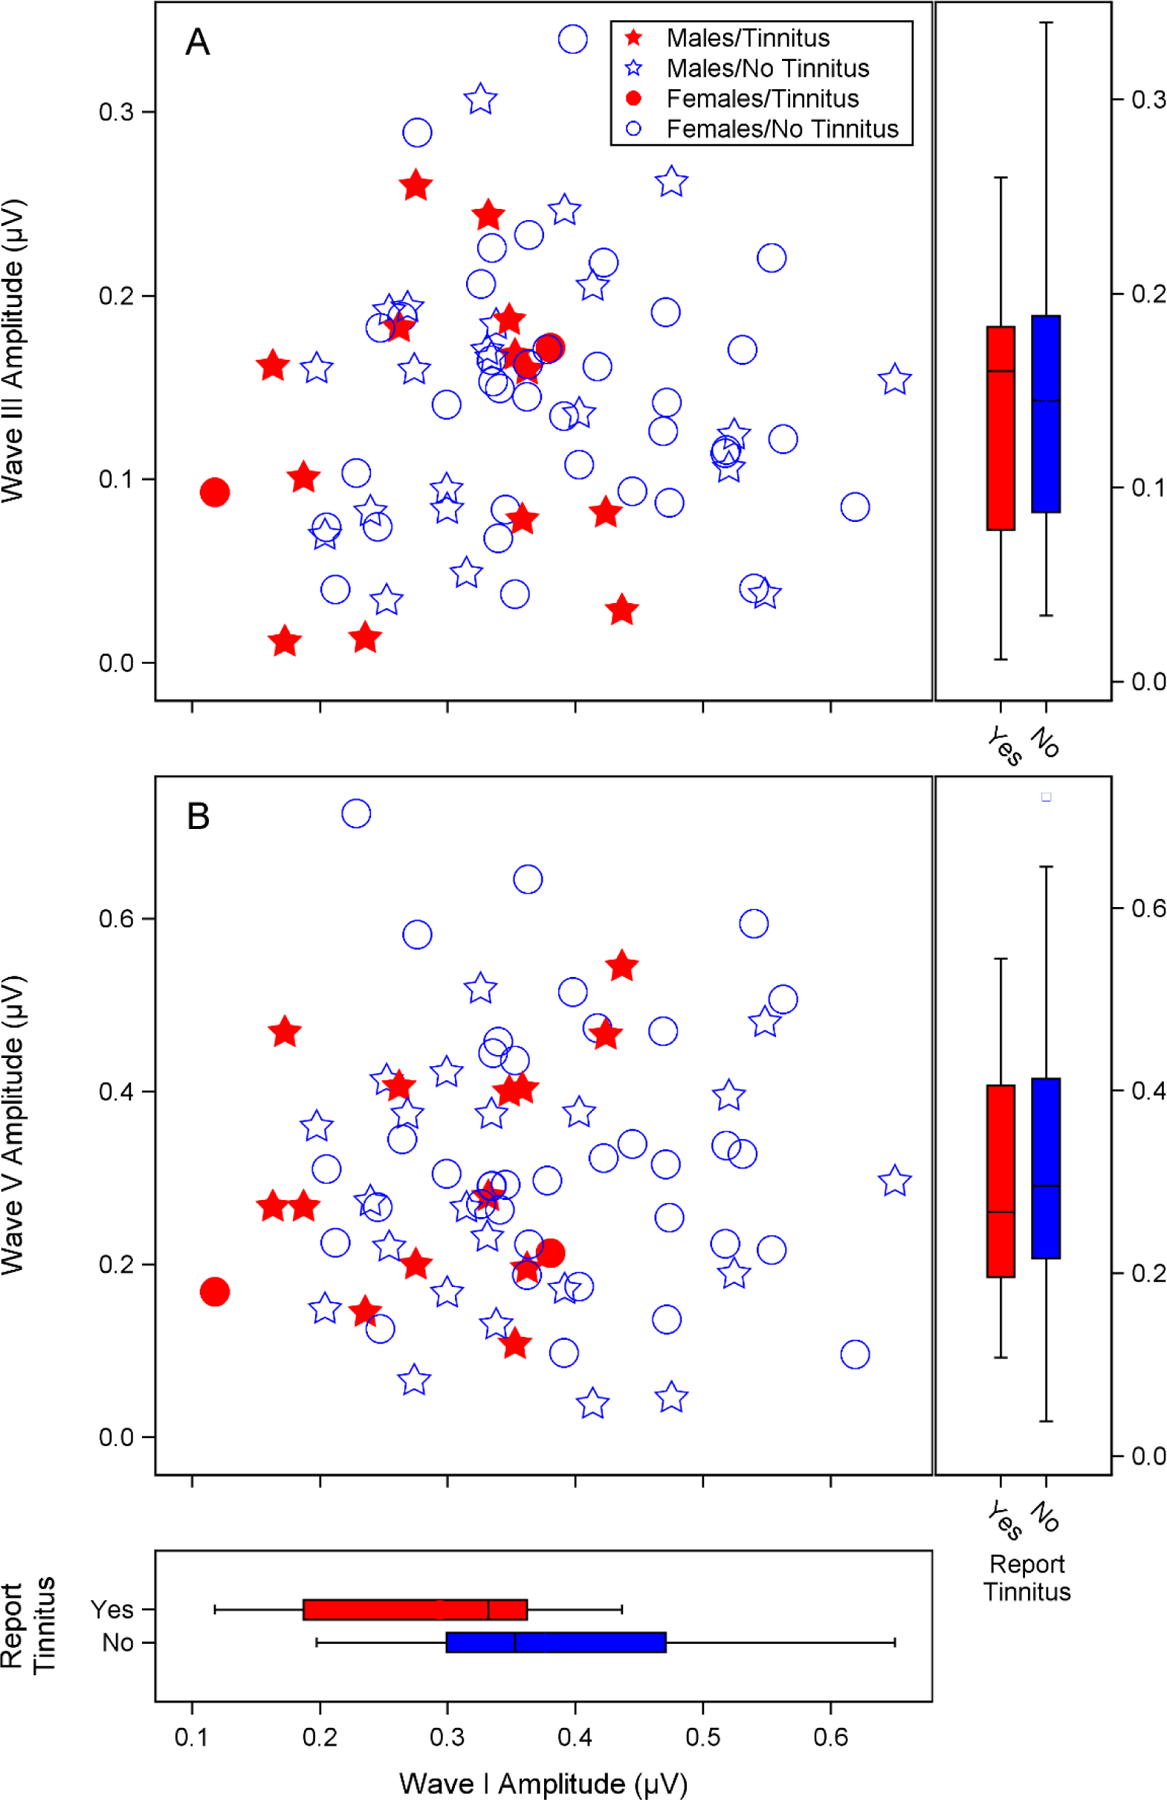
Auditory brainstem response (ABR) wave I amplitude was reduced in participants with tinnitus, but wave III and V amplitudes appeared independent of wave I amplitude and tinnitus perception. Combined scatterplots and boxplots show individual ABR peak amplitudes for a 4 kHz 110 dB p-pe SPL stimulus from males and females with and without tinnitus. Replicate ABR runs for each participant were averaged together to generate a mean amplitude. The scatterplots show mean ABR wave I amplitude versus mean wave III (A) or wave V (B) amplitude. Wave I and III amplitudes were calculated as the voltage difference between the wave peak and the following trough. Wave V amplitude was calculated as the difference between the wave peak and the prestimulus baseline. Males are indicated with stars and females with circles. Filled symbols indicate participants who reported tinnitus. Boxplots show the relationship between wave I, III, and V amplitudes and report of tinnitus. The bottom, midline, and top of the boxes represent the 1st quartile, median, and 3rd quartile respectively, while the end of the whiskers indicate the points furthest from the box that still fall within 1.5 interquartile ranges from the edges of the box. Open circles indicate values outside of this range.