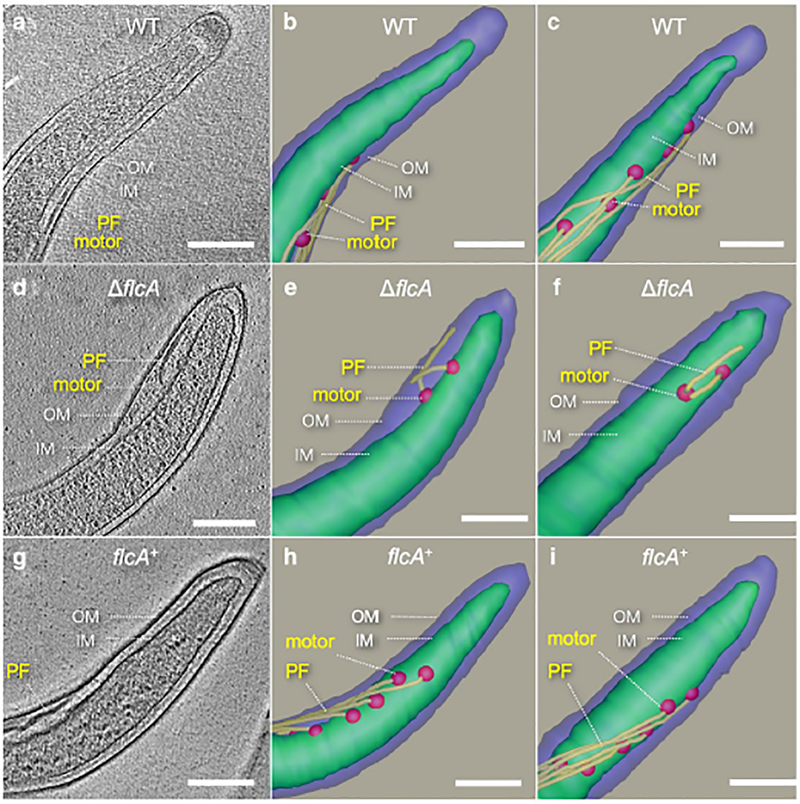
Figure 4. Periplasmic flagella of WT, ΔflcA and flcA+ cells.
(A) A tomographic slice of a WT cell shows normal regular periplasmic flagella. (B, C) Two surface views of the WT cell in two different orientations, respectively. (D) A representative tomographic slice of a ΔflcA cell showing short periplasmic flagella with irregular orientation. (E, F) Two surface views of the ΔflcA cell. (G) A representative tomographic slice of a flcA+ cell. (H, I) Two surface views of the flcA+ cell. The motors are colored in red, the filaments in yellow. The scale bar is 200 nm.

