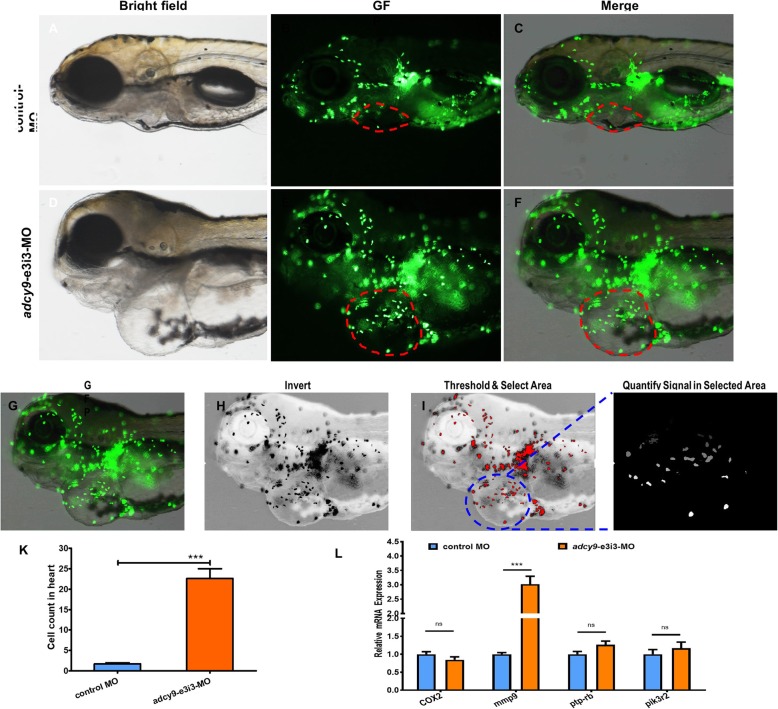
Fig. 2.
Effects of adcy9 knock down on macrophage migration. a-f Representative bright field and fluorescent images of TG (zlyz: EGFP) larvae at 6 days postfertilization (dpf). Control MO injected fish show the normal distribution of labeled cells (b and c). Compared with control fish, embryos injected with adcy9-e3i3-MO present potent macrophage migration in heart (e and f, red circle area). g-k Quantification of the macrophage number at heart shows a 13.3-fold increased in adcy9 morphants. Columns, mean; bars, SEM (n = 10; Student’s t test; ***P < 0.0001;). dpf, days post fertilization. l Endogenous efnb2a, COX2, mmp9, ptp-rb and pik3r2 in control and adcy9 morphants assessed by qRT-PCR (n = 6–10 individual embryos). ns, not significant

