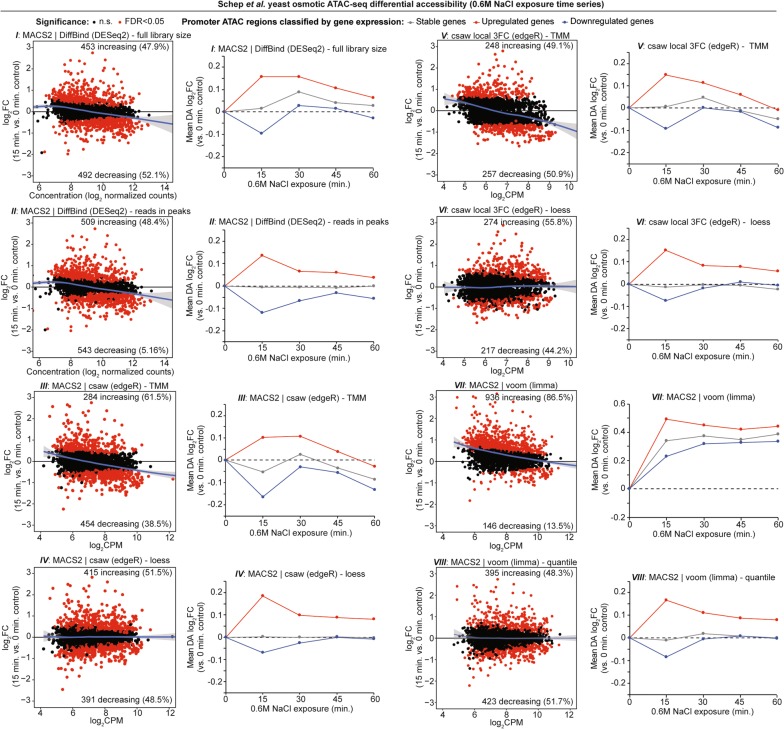
Fig. 3.
Comprehensive DA analysis and gene expression comparisons of yeast osmotic time-course series. Time series analysis of the Schep et al. osmotic stress in yeast ATAC-seq data set with all 8 DA approaches. MA plots are shown for 15-min exposure vs. 0-min controls and exemplary of global effects of data normalization. Time-course line plots depict the mean change in accessibility at each time point compared to control samples, for all gene promoter ATAC regions defined by respective gene expression changes. Gene expression changes following the same 0.6 M NaCl treatment reported by Ni et al. are defined as stable expression (gray line), upregulated expression (red line), and downregulated expression (blue line). See Additional file 1: Figure S4 for complete data and statistical analysis of time-course series with all 8 approaches

