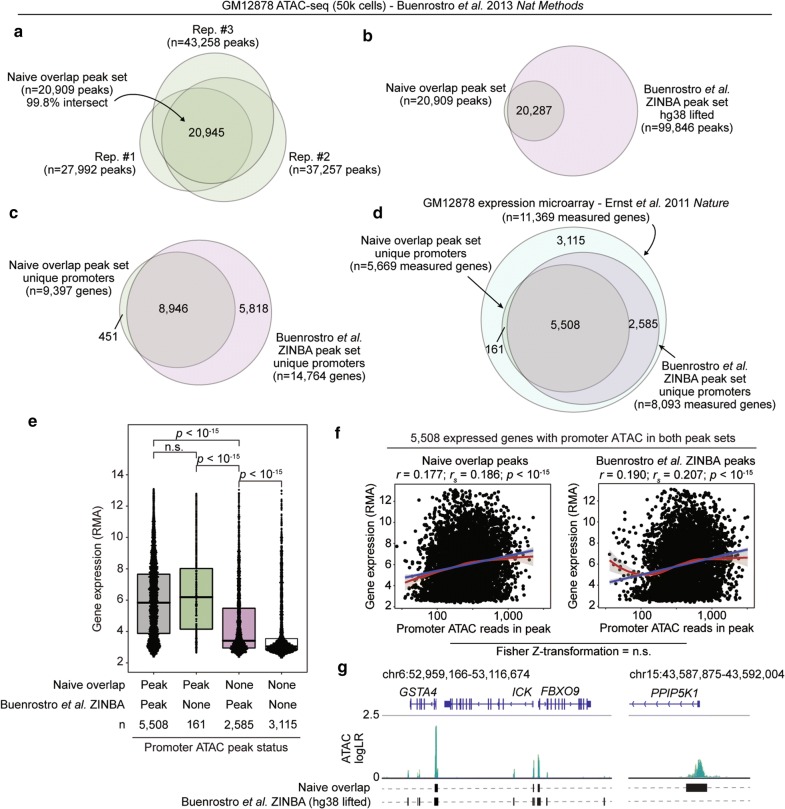
Fig. 5.
Conservative and relevant peak calling by proposed framework exemplified on Buenrostro et al. data. a Overlap of MACS2 broad peaks called with proposed workflow between independent GM12878 ATAC-seq replicates from Buenrostro et al. Naïve overlap identifies 99.8% of fully replicate-intersecting peaks. b Genome-wide overlap of naïve overlap peak set generated herein compared to ZINBA peak set reported by Buenrostro et al. c Overlap of genes with detected ATAC promoters identified in the two peak sets as in b. d Overlap of expression-measured genes with detected ATAC promoters in the two peak sets compared to all measured genes. GM12878 expression data was pulled from a microarray data set generated by Ernst et al. e Microarray log2 expression levels (RMA) of genes segregated by promoter ATAC peak status detected between the two peak sets. Genes were binned as having a detected peak in both sets, only by naïve overlap herein, only by Buenrostro et al. ZINBA, or neither. Statistic is unpaired, two-tailed Wilcoxon test. f Correlation of promoter ATAC peak signal and gene expression for 5508 genes with a detected promoter ATAC peak in both peak sets. ATAC signal is quantified by reads in peak (log10 scale; linear values displayed on axis for clarity), and the strongest value was selected to represent promoters with multiple peaks. Correlation statistics displayed are Pearson and Spearman. Overlaid linear fit is displayed in red and loess in blue. Fisher Z-transformation was used to compare correlation coefficients between both peak sets. g Example ATAC-seq signal tracks showing peaks called (black bars) at different loci between the two peak sets. All three replicates are overlaid with darker colors representing overlapping replicates. Y-axis is log likelihood ratio of peak signal

