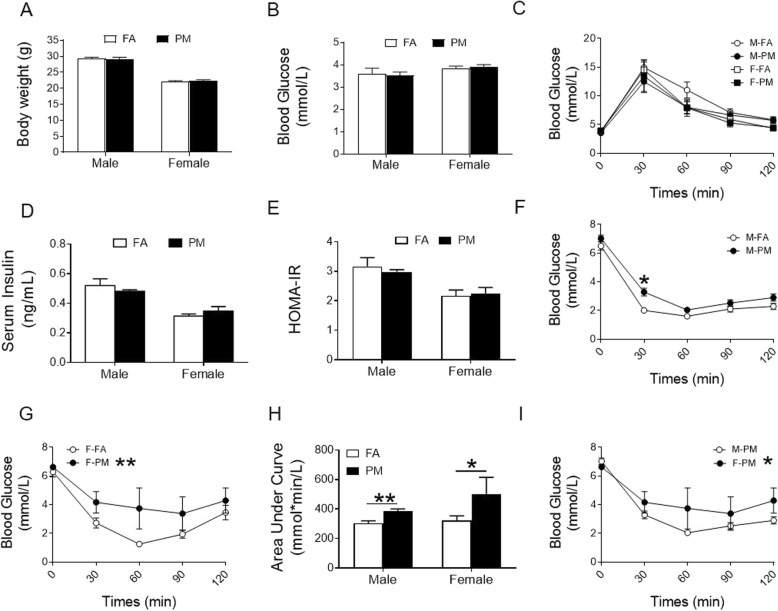
Fig. 2.
Effects of PM2.5 exposure on body weight and glucose homeostasis in C57BL/6 mice. A, Body weight of mice at the end of PM2.5 exposure. B, Fasting blood glucose at the end of PM2.5 exposure. C, GTT in fasted mice at the end of PM2.5 exposure. D and E, Fasting insulin levels and HOMA-IR at the end of PM2.5 exposure. F-G, ITT in fasted male (F) and female (G) mice at the end of PM2.5 exposure. H, ITT analysis with AUC (area under curves). I, ITT in fasted male and female mice exposed to PM2.5. *P < 0.05, **P < 0.01 for each comparison. * beside the legend in the figure panel denotes overall difference. n = 5-8

