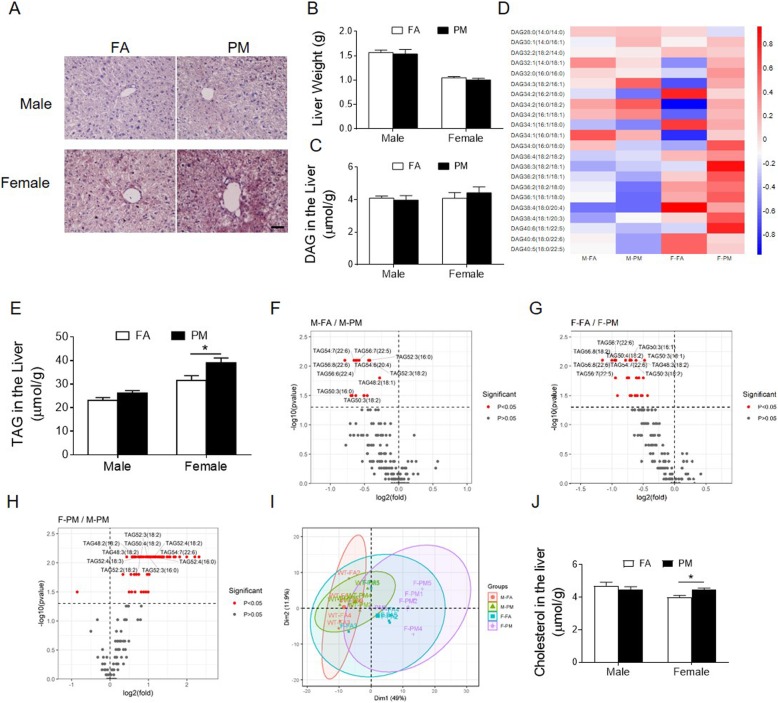
Fig. 3.
Effects of PM2.5 exposure on neutral lipids in the liver. A and B, Representative images of oil red O staining of liver sections (A) and liver organ weight (B). scale bar = 100 μm. C and D, Total DAG levels (C) and Hierarchical clustering heatmap analysis of DAG lipids (D) in the hepatic lipid extracts from mice. E, Total TAG levels in the hepatic lipid extracts from mice. F-H, Volcano plots of all TAG species detected in the liver from male mice exposed to FA and PM2.5 (F), from female mice exposed to FA and PM2.5 (G) and from PM2.5-exposed male and female mice (H). P < 0.05 is in red. I, PCA analysis of whole lipidome of male and female mice exposed to FA or PM2.5. J and K, Major species of CE with significant difference in the hepatic lipid extracts from male (J) and female (K) mice. *P < 0.05 for each comparison. n = 5 for lipidomics study and n = 7–8 for oil red O examination

