
Figure 2.
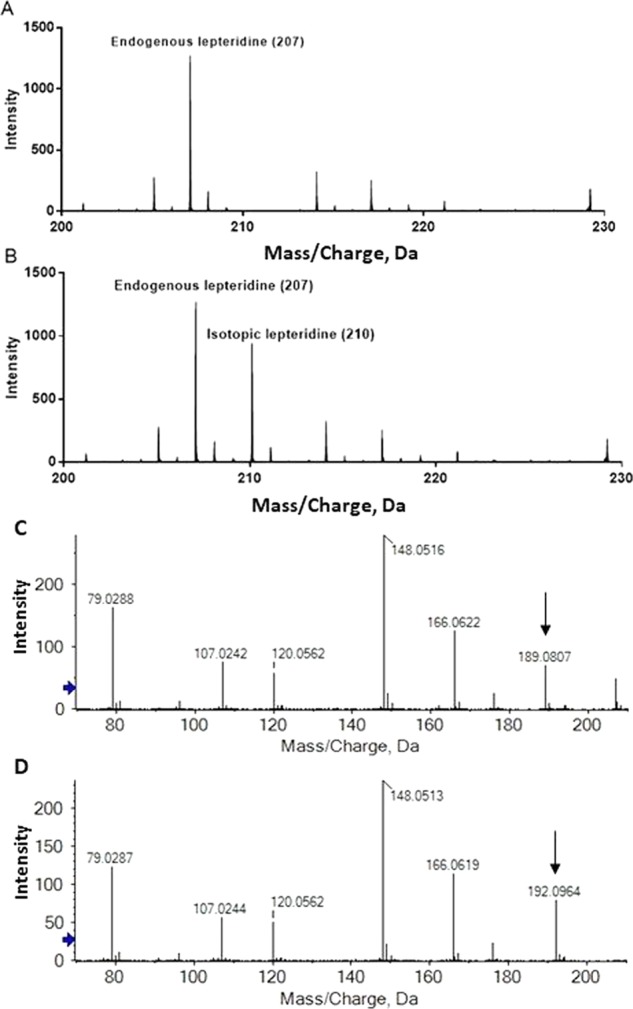
Mass spectrum of a typical manuka honey sample before (A) and after (B) supplementation with isotopic lepteridine. MS/MS spectrum of endogenous lepteridine (C) and isotopically labeled lepteridine (D). Black arrows denote a 3 amu shift in one of the fragment ions.