Figure 2.
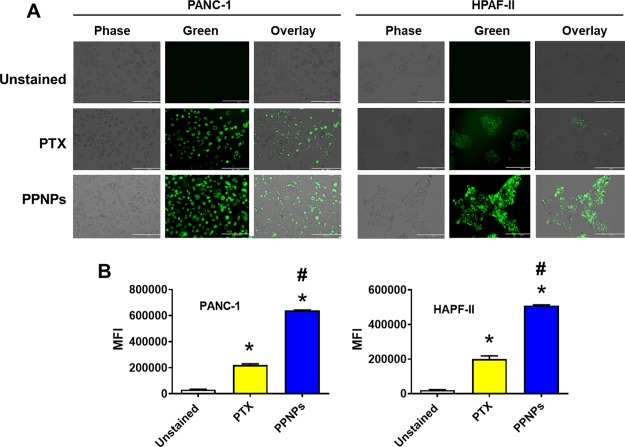
Drug efflux inhibition phenomenon evaluated by Rh123 dye exclusion assay. (A) Cancer cells were treated for 24 h with 10 nM PTX or 10 nM PPNPs and incubated with Rh123 for 30 min before visualizing them under a microscope to obtain representative images. Rh123 showed more accumulation in treatment groups of PPNPs, indicating P-gp and drug export inhibition in this treatment group. (B) Mean fluorescence intensity in an FL1 channel (488 excitation, blue laser, 530 ± 15 nm, FITC/GFP) was measured for treatment groups. PPNPs showed increased fluorescence in both PanCa cells as compared to 10 nM PTX treatment, indicating that PTX in solution gets effluxed because of P-gp. Data are presented as the mean ± SEM (n = 3). *p < 0.05 and #p < 0.05 represent the significant value compared to the control and PTX, respectively.

