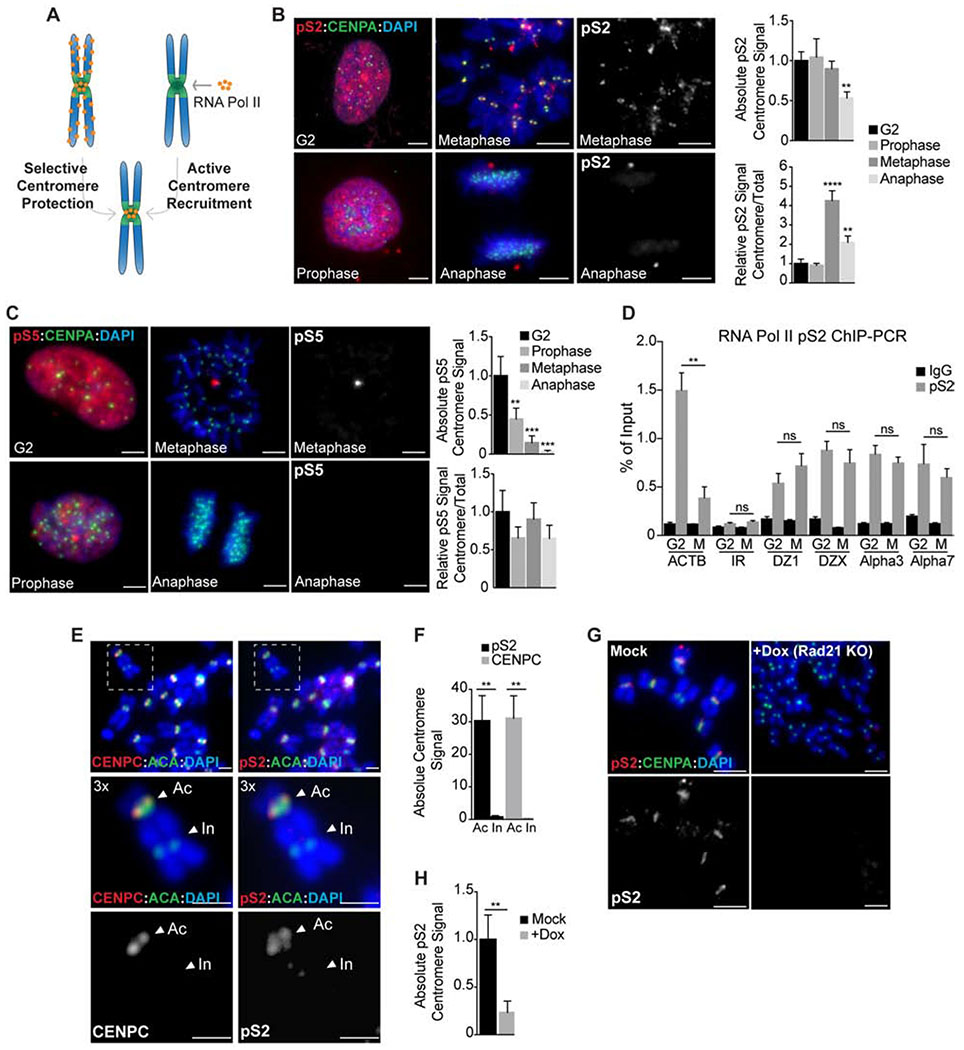
Figure 1. Cohesin promotes the selective retention of RNA Pol II at centromeres in mitosis.
A. Either selective chromosome arm removal or active centromere recruitment early in prophase could explain RNA Pol II enrichment at metaphase centromeres. B-C RNAP pS2 and pS5 localization (red) in chromosome spreads from RPE-1 cells cycled from interphase (G2) to anaphase. Anti-CENPA antibodies (green) and DAPI (blue) were used to visualize centromeres and DNA respectively. Scale bars, 10 μm. Right, quantification of absolute and relative centromere signal. **, P < 0.005; ***, P < 0.001; ****, P < 0.0001 (one-way ANOVA, Dunnett’s test). D pS2 occupancy at centromeres of chromosomes 1, 3, 7 and X, represented as the % of input recovered following ChIP in G2 or metaphase (M) RPE-1 cells. Occupancy values at the ACTB gene and at a random intergenic region (IR) were included as positive and negative controls, respectively. **, P < 0.005; (ns) no significant differences (t-test). E-F Analysis of CENPC and pS2 localization (red) in metaphase spreads from dicentric MDA-MB 435 cells. ACA (anti-centromere antibodies; green) stains both active (Ac) and inactive (In) centromeres while CENPC and pS2 (red) are only recruited to the active kinetochore region. Scale bars, 5 μm. Quantification of pS2 and CENPC centromere signal is plotted on F. **, P < 0.005 (t-test). G-H Analysis of pS2 localization (red) on metaphase spreads from doxycycline inducible Rad21 KO cells. Anti-CENPA (green) and DAPI (blue) were used to visualize centromeres and DNA, respectively. Scale bars, 10 μm. Quantification of absolute pS2 centromere levels is represented in H. **, P < 0.005 (t-test). In all cases error bars indicate the standard deviation of the mean.

