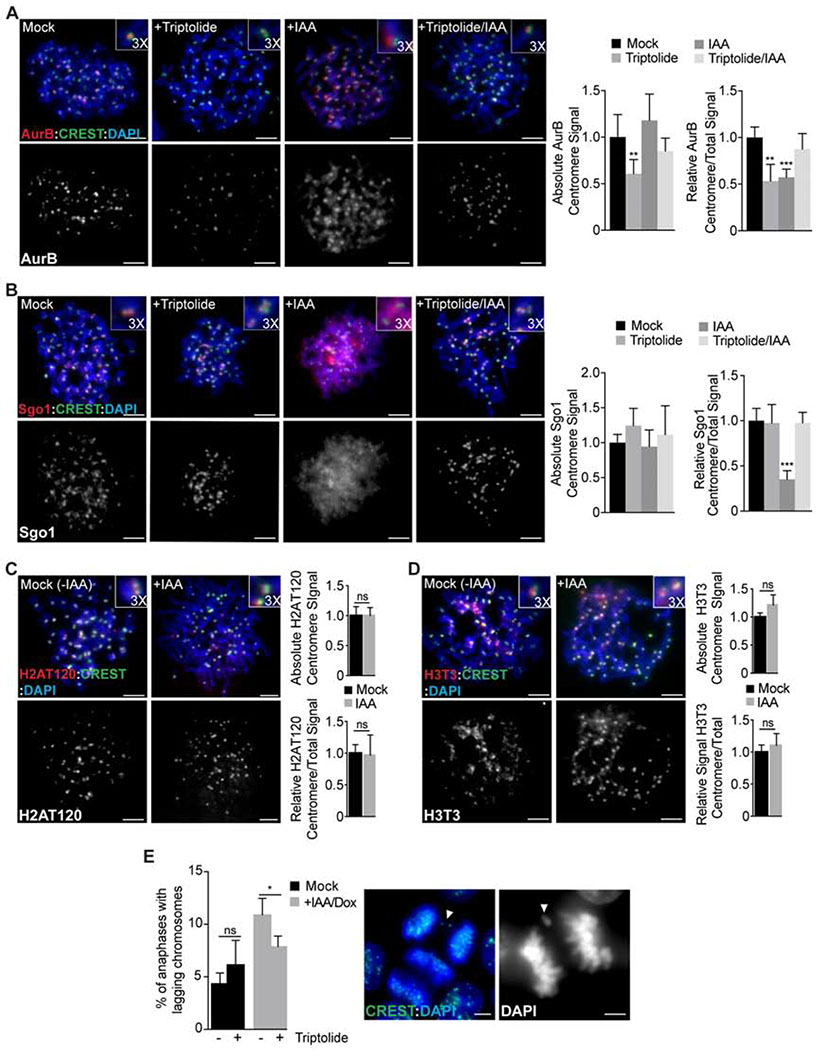
Figure 5. Ectopic RNA Pol II activity on metaphase chromosomes impairs Aurora B and Shugoshin 1 localization causing chromosome segregation defects.
A-B Analysis of Aurora B (AurB, A) and Shugoshin 1 (Sgo1, B) localization (red) in metaphase chromosome spreads from control (mock) WAPL-AID cells or following treatment with Triptolide, IAA/Dox or IAA/Dox + Triptolide. Quantification of absolute and relative centromere signal is showed on the right. Error bars indicate the standard deviation of the mean. **, P < 0.005; ***, P < 0.001 (one-way ANOVA, Dunnett’s test). C-D Analysis of H2AT120 (C) and H3T3 (D) localization (red) in metaphase chromosome spreads from control (mock) or auxin-treated WAPL-AID cells. Quantification of absolute and relative centromere signal is showed on the right. Error bars represent the standard deviation of the mean. (ns) no significant differences (t-test). E % of anaphases showing lagging chromosomes measured in control (mock) WAPL-AID cells or after treatment with Triptolide, IAA/Dox or IAA/Dox + Triptolide. Error bars indicate the standard deviation of the mean. *, P < 0.05; (ns) no significant differences (t- test). Example of anaphases showing lagging chromosomes are showed on the right. In all cases, anti-centromere antibodies (CREST; green) and DAPI staining (blue) were used for centromere and chromosome labelling, respectively. Scale bars, 5 μm.

