Figure 2.

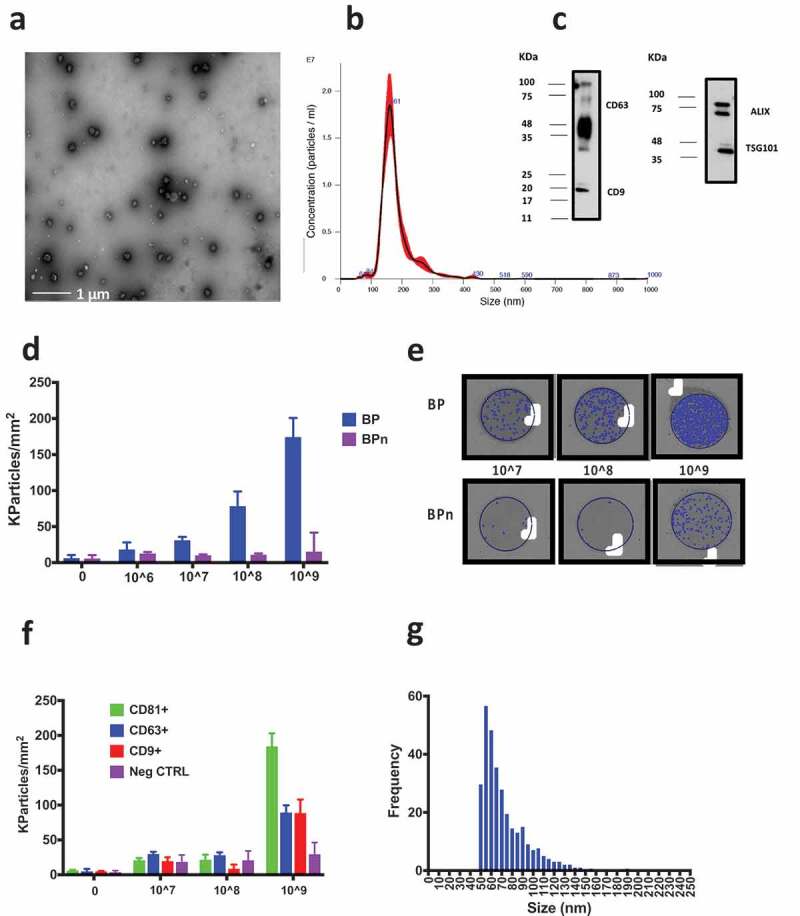
Characterisation of UC-isolated EVs from HEK cell-line culture performed by TEM, NTA and WB. (a) TEM imaging of the bulk UC-isolated HEK EVs after negative staining by phosphotungstic acid. (b) Results of the analysis by NTA providing a mean particle size of 180 ± 1 nm and a concentration of 1.2 × 10¹² particles/mL. (c) The presence of transmembrane protein CD63 and CD9 and luminal proteins ALIX and TSG101 was assessed by Western blotting. The UC preparation resulted positive to all the four proteins. (d) HEK UC particle density per mm2 detected on BP and BPn peptide spots in a blank sample (filtered PBS) and in 1 × 10⁶–1 × 10⁹ particles/mL concentrations range. A clear dose-response effect is visible. Signal on BPn peptide is negligible. (e) Representative images of BP and BPn peptide spots incubated with 1 × 10⁷–1 × 10⁹ particles/mL: blue dots indicate detected particles. (f) HEK UC particle density per mm2 detected on antibody microarray (anti CD81/CD63/CD9). Only 1 × 10⁹ particles/mL concentration provides on CD antibodies spots a signal distinguishable from that on the negative control antibody. (g) Observed size distribution of captured particles reported as the number of counts detected in each 5 nm bin. Representative peptide spot images are reported in the supplementary information (Figure S1).
