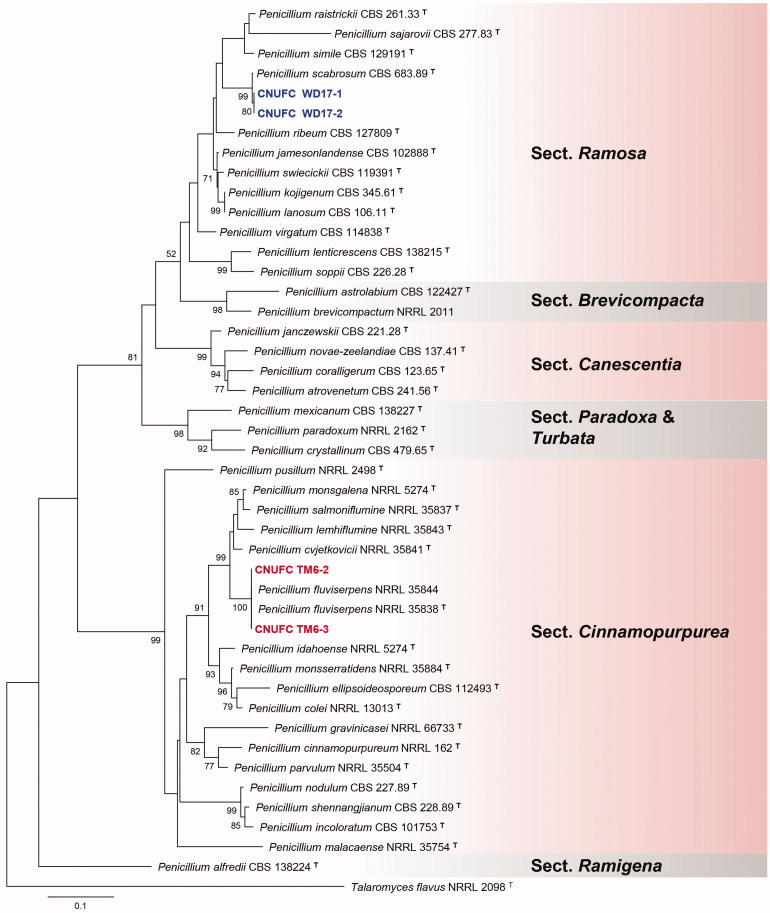
Figure 2.
Phylogenetic tree of Penicillium fluviserpens CNUFC TM6-2 and CNUFC TM6-3, P. scabrosum CNUFC WD17-1 and CNUFC WD17-2 and related species, based on the maximum likelihood analysis of the combined BenA and CaM sequences. Sequence of Talaromyces flavus was used as an out group. Numbers at the nodes indicate the bootstrap values (>50%) from 1000 replicates. The bar indicates the number of substitutions per nucleotide. The study isolates are shown in bold blue and red.

