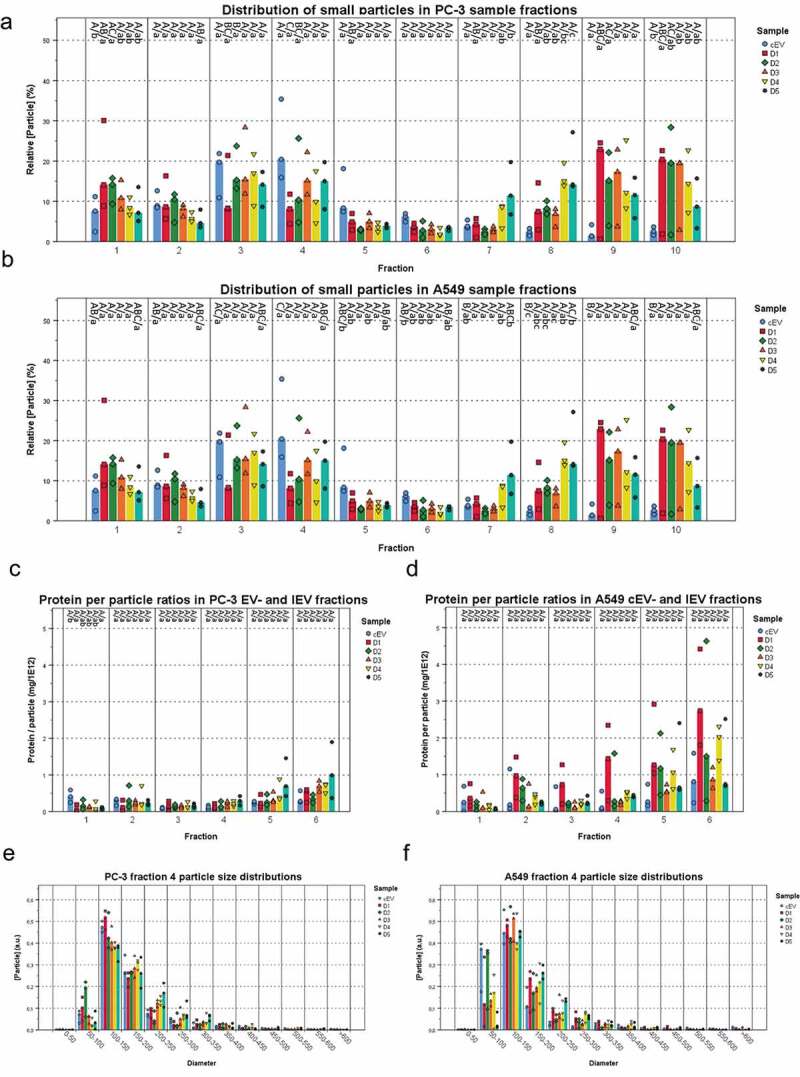
Figure 5.

IEVs and control EVs have similar sizes and a density dependent protein content. The particle concentrations (a and b) were measured from each fraction of IEV and cEV samples and presented as relative concentrations compared to the other fractions of each sample. All of the samples showed a peak in particle concentration at fractions 3 and 4, corresponding to the IEVs and cEVs. In cEV preparations, the particle was more significant due to the longer production time. (c and d) Protein per particle ratios were calculated using total protein and particle concentrations for each IEV and cEV fraction. These values were found to be consistent across D1–D5. Although the denser fractions seemed to have a higher value, there were no statistically significant differences due to the small sample size. The size distribution of fraction 4 from each sample (e and f) is presented as a representative fraction of the IEVs and cEVs. The median particle diameter was 100–150 nm in each sample, with the mean size growing at later time points. Additional size distributions for fractions 1–6 presented in Supplementary Figures 2 and 3 together with the total protein distributions of each sample. For each sample, data is presented as medians with individual results, with N = 3 for each sample. Statistical significance in a–d was assessed using one-way ANOVA with Tukey’s HSD post hoc test, denoted by grouping with letters: for all variables with the same letter, the difference between the means is not statistically significant. If two variables have different letters, they are significantly different. Uppercase letters denote fractions of the same time point while lower case letters denote different time points of each fraction. p-values of statistically differing samples for particle and protein concentrations are listed in the Supplementary Figures 7 and 8, respectively.
