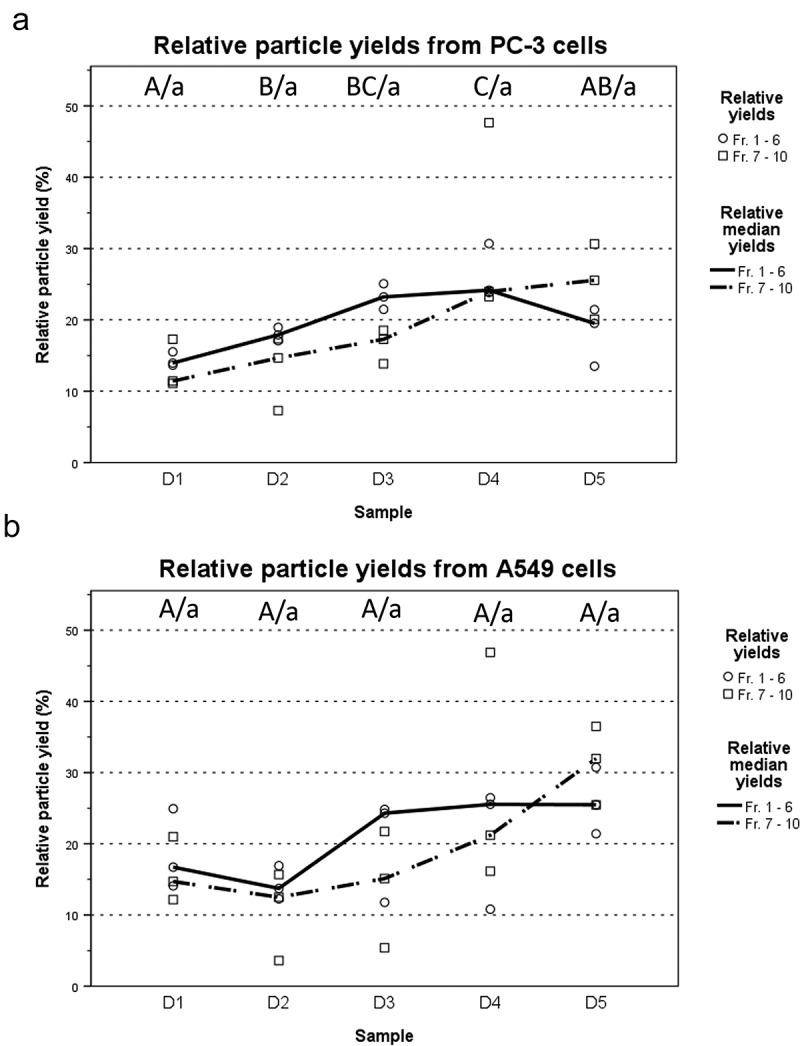
Figure 6.

Particle yields increase as the infection progresses. (a and b) Total particle yields for each time point were calculated separately for fractions 1–6 representing the IEVs, and fractions 7–10 containing free virions and large impurities. Total yields were normalized across all time points of each experiment and are presented as relative particle yields, with individual yields (N = 3) and their median for each time point. The overall trend was that particle yields increased along the progression of the infection, although the variation between samples was high. Statistical significance was assessed using one-way ANOVA with Tukey’s HSD post hoc test, denoted by grouping with letter: time point samples with no significant difference are given the same letter, capitalized for fractions 1–6 and lower case for fractions 7–10. p-values of statistically differing samples are listed in the Supplementary Figure 9.
