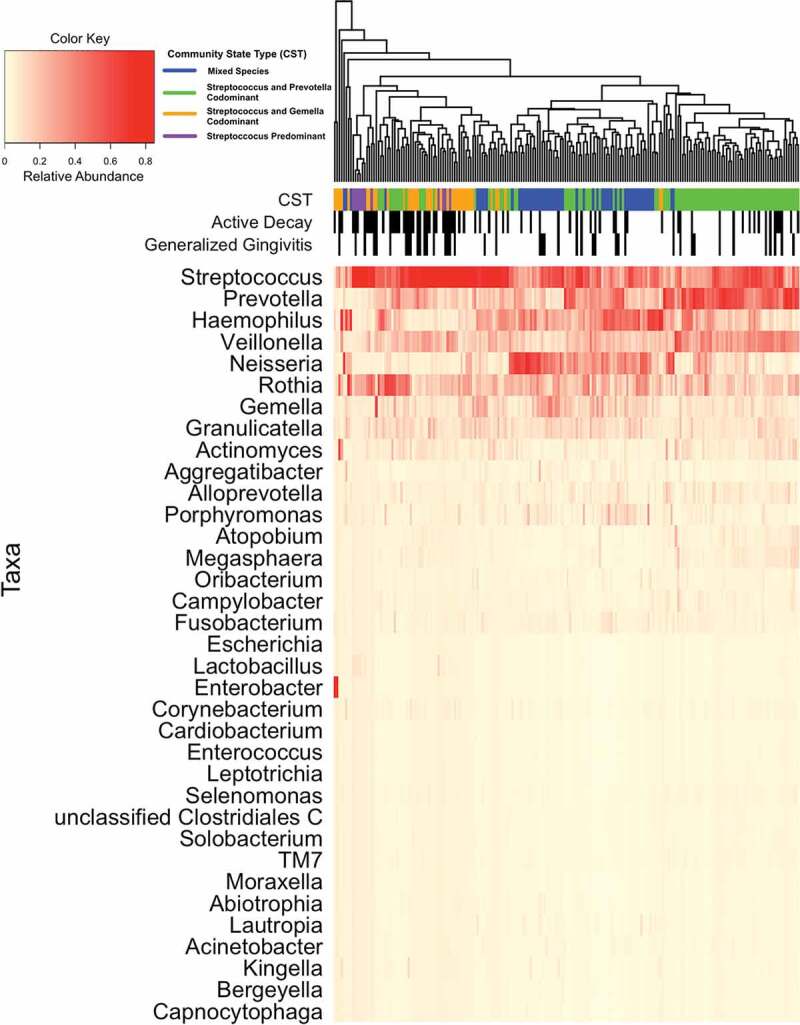
Figure 2.

Heat map showing the relative abundance of salivary taxa at 2 months and 12 months (n = 77) post-partum (Pennsylvania participants) and 2 and 12 (n = 2) or 2 and 24 (n = 22) months post-partum (West Virginian participants). Women participating in the Center for Oral Health Research in Appalachia Cohort 2. Each column represents results from one sample; each individual appears twice. Dendrogram shows Bray-Curtis distance between salivary microbiomes by the overall distribution of taxa. The top three rows under the dendrogram indicate community state type (CST), presence of active decay, and generalized gingivitis of each individual, respectively. CSTs were identified using Dirichlet multinomial mixed models and named based on the organisms present
