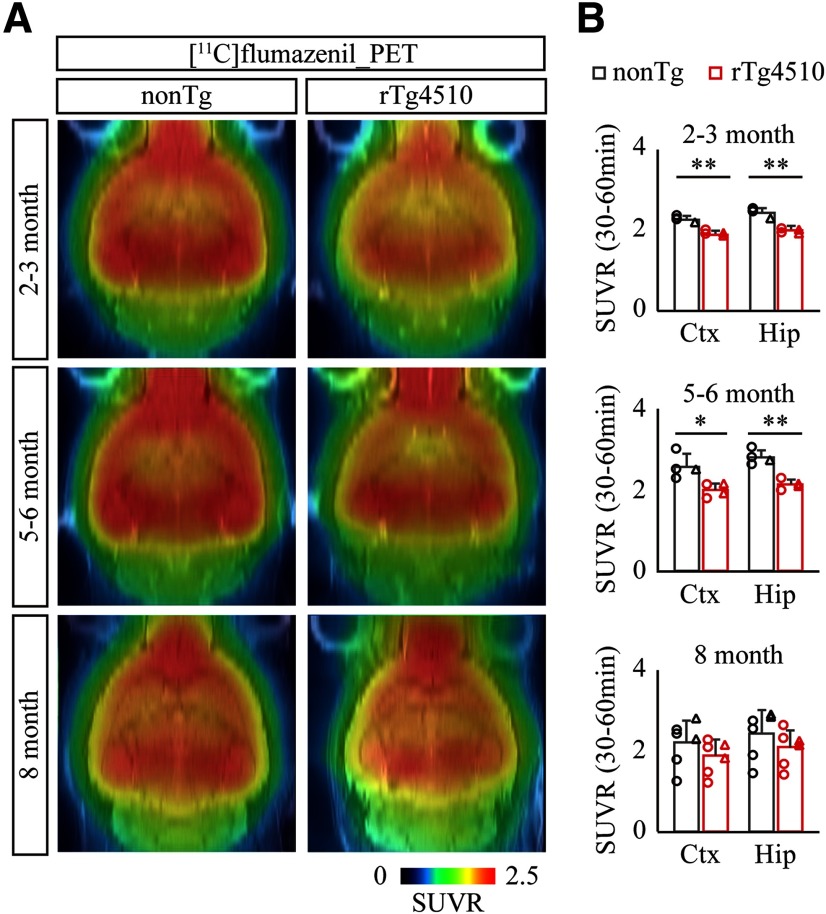
Figure 3.
PET assessment of inhibitory synapse with [11C]flumazenil in rTg4510 brain. A, NonTg and rTg4510 mice were subjected to PET scans at age 2-3 months (top panels), 5-6 months (middle panels), and 8 months (bottom panels) after peripheral bolus administration of [11C]flumazenil. Representative PET images generated by averaging dynamic scan data at 30-60 min are shown. MR images of individual animals were captured and overlaid for spatial alignment. B, Age-dependent alteration of averaged SUVR with [11C]flumazenil PET was analyzed in cortex (Ctx) and hippocampus (Hip). Brainstem was set as reference region. Data from 4-6 mice/genotype at age 2 months (top graphs), 5 months (middle graphs), and 8 months (bottom graphs) are plotted as mean ± SD. Each circle represents an individual male mouse. Each triangle represents an individual female mouse. *p < 0.05; **p < 0.01; Student's t test.

