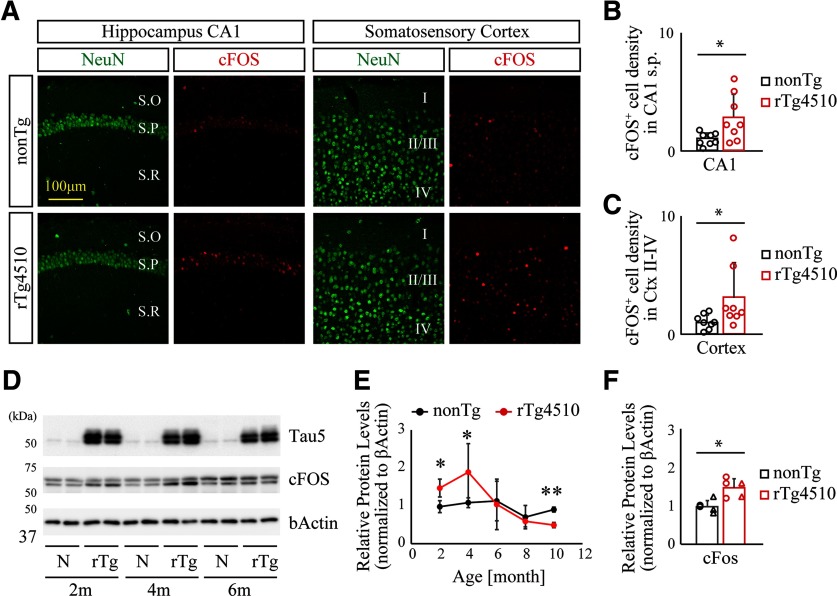
Figure 7.
Enhanced cFos level in young rTg4510 brains. A, Representative slice images immunolabeled with anti-NeuN and anti-cFos antibodies in hippocampus CA1 (left panels) and somatosensory cortex (right panels). S.O, Stratum oriens; S.P, stratum pyramidale; S.R, stratum radiatum. B, C, Densities of cFos+ neurons in hippocampus CA1 stratum pyramidale (B) or somatosensory cortex (C). Data from 8 mice/genotype are demonstrated as mean ± SD. Mean value of nonTg mice was set as 1. *p < 0.05 (Student's t test). D, Representative immunoblot demonstrating enhanced levels of cFos protein in young rTg4510 brains. E, Age-dependent alteration of cFos levels was quantified and normalized by the level of β-actin. Data from 3–5 independent mouse brains are plotted as mean ± SD. *p < 0.05; **p < 0.01; Student's t test. F, Enhanced levels of cFos protein in forebrain homogenate from 2-month-old rTg4510 brains. Each circle represents an individual male mouse. Each triangle represents an individual female mouse. Mean value of nonTg mice was set as 1. *p < 0.05 (Student's t test).

