Figure 1.
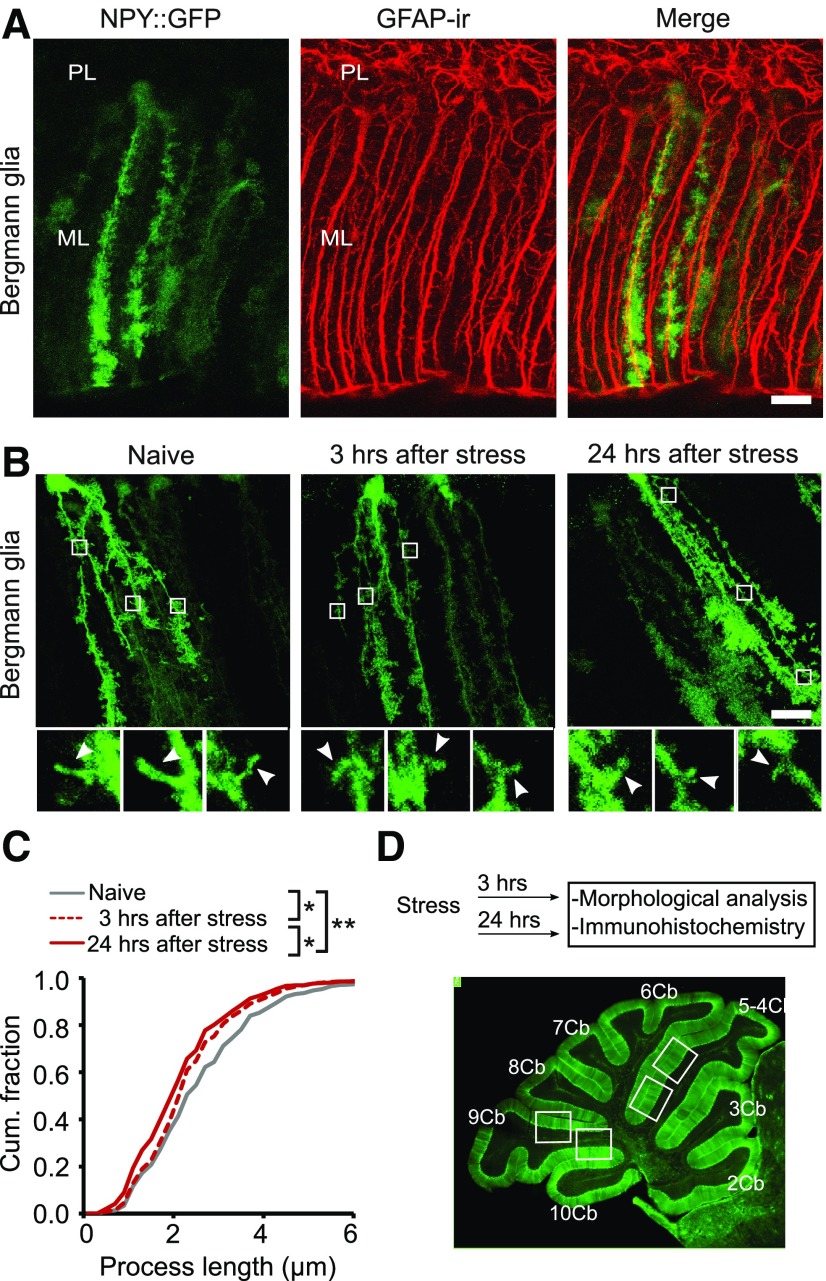
Bergmann glial cell lateral processes are shorter after stress. A, Confocal images showing that NPY::GFP mice exhibit fluorescent labeling of a subset of GFAP-positive Bergmann glial cells. B, Retraction of the lateral processes of Bergmann glial cells was evident 3 h after exposure to fox urine, and the effect became more pronounced at 24 h. Top panels show whole-cell images, and each was made from a z-projection of all 25–30 confocal slices. Inserts illustrate z-projections of two to three consecutive confocal slices to reveal individual processes. C, Cumulative distribution of the length of lateral processes in Bergmann glial cells from naive mice, and at 3 and 24 h after stress exposure (836–914 processes from 22–24 cells/each condition; N = 7). D, Top, Schematic representation of the experimental design. Bottom, Sagittal section of the cerebellum from a GFAP::GFP mouse showing the lobules and areas analyzed in this study (lobules 5 and 9). ML, Molecular layer; PL, Purkinje cell layer. Scale bar, 20 µm. *p < 0.0001; **p < 0.000001 (Kolmogorov–Smirnov test).

