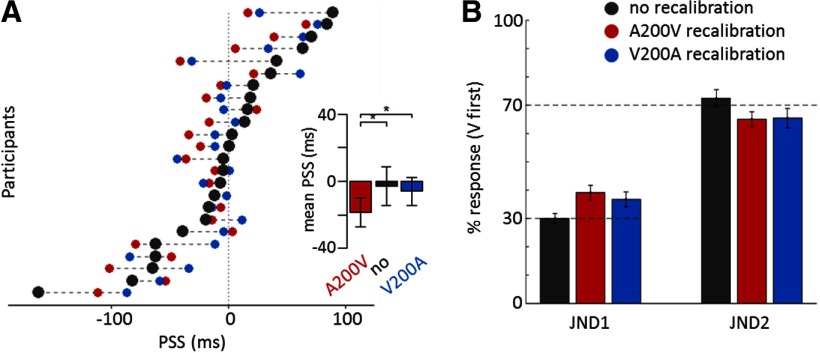
Figure 2.
Behavioral results. A, Each line shows the participant's PSSs for each condition (gray, no; red, A200V; blue, V200A). The insert depicts the group-averaged PSS for each condition (error bars shows ±1 SEM). Asterisks indicate the significance level of the repeated-measure one-way ANOVA (with *p < 0.05). B, Behavioral results of the EEG session. The percentage of flash-first responses is shown for each SOA (JND1 and JND2) and adaptation condition (error bars show ±1 SEM).

