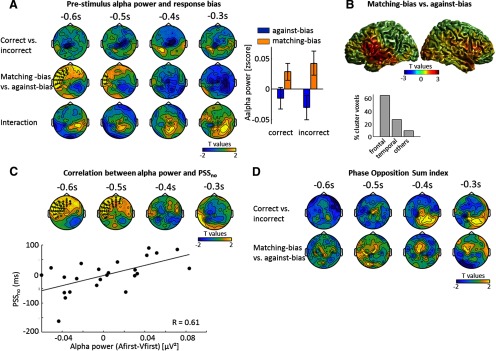
Figure 3.
Prestimulus alpha power and idiosyncratic bias. A, Statistical maps from an ANOVA testing for main effects (correctness, matching bias) and an interaction performed for the no-recalibration condition on prestimulus alpha power (7.1–12.8 Hz). One positive significant cluster for biasedness was found. Each topography shows the average t map across a 100 ms temporal window starting at the indicated time point. The bar graph shows alpha power within the significant cluster, for each response (mean ± SEM across participants). B, Source-space contrast of prestimulus alpha power between matching-bias and against-bias responses between −600 and −200 ms. The center of mass of the cluster corresponding to uncorrected p < 0.05 is located in the left rolandic operculum. Sixty-four percent of the cluster covers left frontal areas, 27% left temporal areas, and 9% left postcentral areas and insula (based on the AAL atlas). C, Correlation between PSSno and the α difference (Afirst-Vfirst) tested using a spatiotemporal cluster based permutation test. One significant cluster was found. D, The POS index was used to determine whether the instantaneous alpha phase has different concentration between two conditions. No significant cluster was found.

