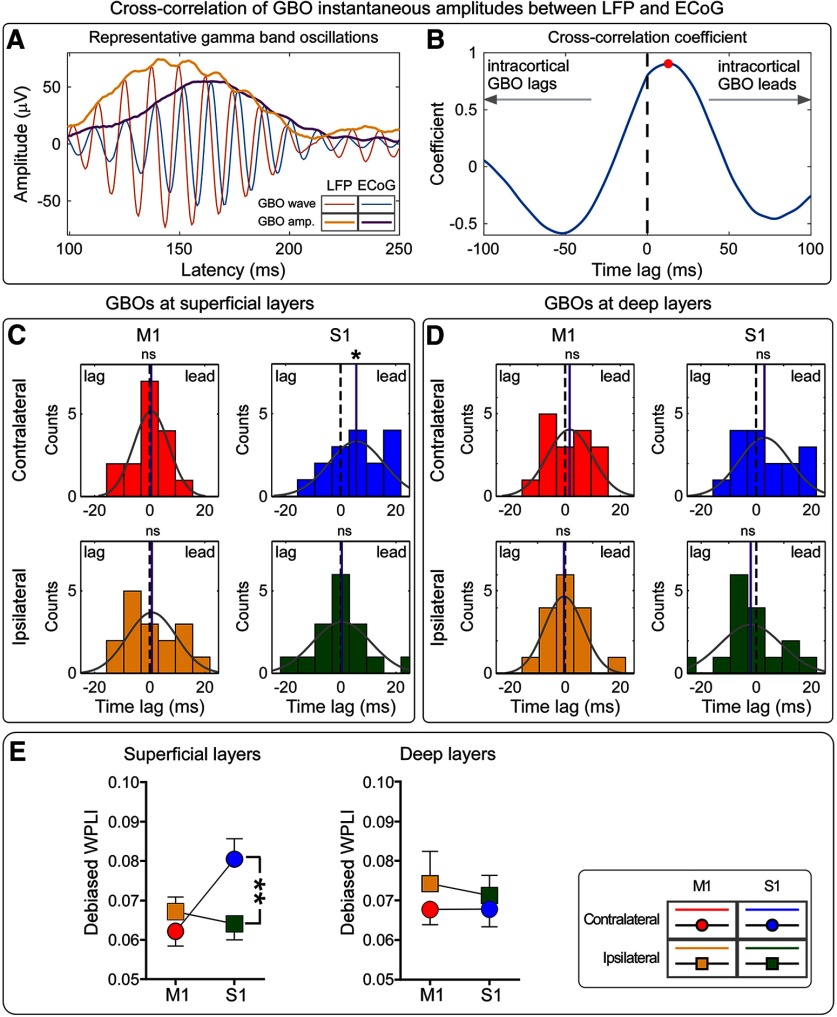
Figure 4.
The temporal sequence and phase relationship between GBOs measured intracortically and epidurally. A, Representative GBOs (time, 100–250 ms; frequency, 70–100 Hz) recorded intracortically and epidurally are displayed in red and blue, respectively; their instantaneous amplitudes are displayed in orange and purple, respectively. B, Cross-correlation coefficients of the instantaneous amplitudes of representative intracortical and epidural GBOs. The maximal coefficient occurs at a time lag larger than zero (i.e., red dot), indicating that the instantaneous amplitude of intracortical GBOs leads that of epidural GBOs. C, D, Distribution of time lags at which the cross-correlation coefficients between intracortical and epidural GBOs is maximal. Data are recorded from S1 and M1, contralateral and ipsilateral to stimulation side (C, superficial layers; D, deep layers). For each plot, the gray curve represents the normal distribution fitting; the mean of each fitting is marked with a purple line. Wilcoxon rank sum test statistics indicated that only the instantaneous amplitude of GBOs measured from the superficial layers of the contralateral S1 lead that of epidural GBOs. Statistical results are summarized in Extended Data Figure 4-1. E, The debiased WPLI measures the phase relationship between intracortical and epidural GBOs. There was strong evidence that WPLI values calculated for GBOs measured at superficial cortical layers were modulated by an hemisphere × brain region interaction: they were larger in contralateral than in ipsilateral S1, but were similar in contralateral and ipsilateral M1. In contrast, there was no evidence for any effect of recording site on WPLI values at deep cortical layers. Statistical results are summarized in Extended Data Figure 4-2. *p < 0.05, **p < 0.01. ns, Not significant. Error bars represent SEM.

