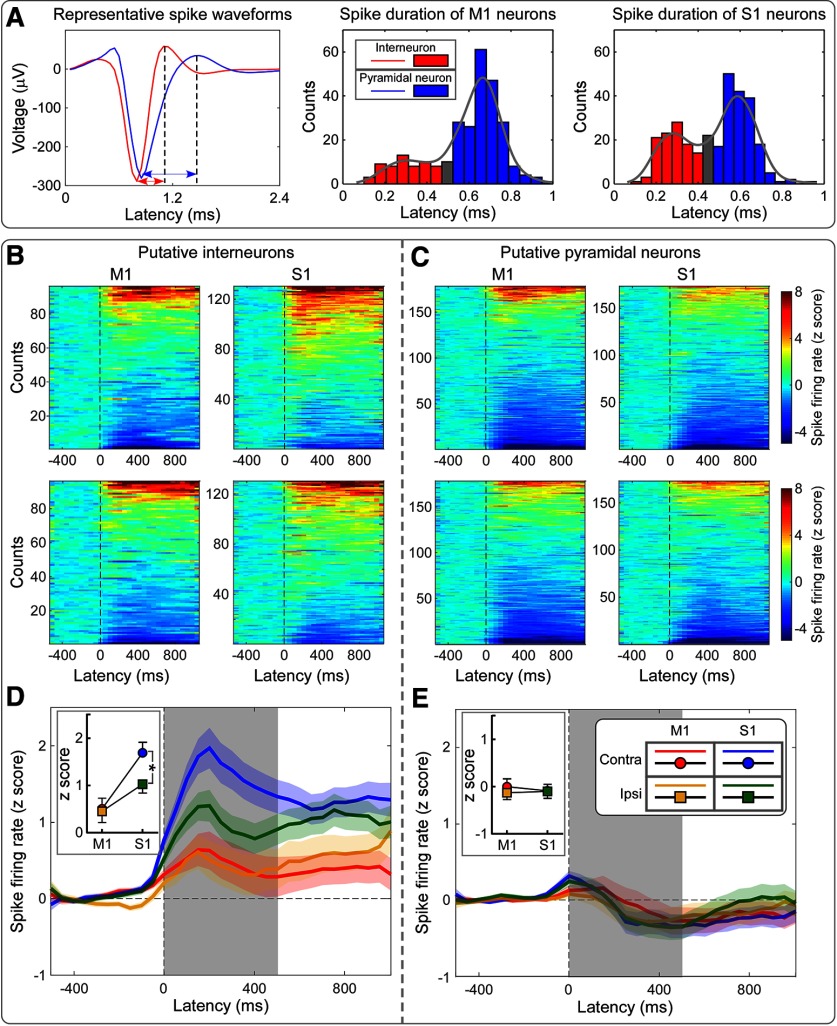
Figure 5.
Laser-evoked spikes of putative interneurons and pyramidal neurons at the four recording sites (bilateral S1 and M1). A, Representative spike waveforms of a putative interneuron and a putative pyramidal neuron are displayed in red and blue, respectively (left). Spike durations are marked using double-headed arrows. Note that the spike duration of the putative interneuron is shorter than that of the putative pyramidal neuron. Distributions of spike durations: M1, middle; S1, right. In both regions, spike durations showed a bimodal distribution, which was used to identify cells as putative interneurons (red), pyramidal neurons (blue), and unclassified neurons (gray). B, C, Spike-firing rates of putative interneurons (B) and pyramidal neurons (C) at the four recording sites. Spike-firing rates, expressed as z-scores, were normalized with respect to the baseline (i.e., 500 ms preceding the nociceptive stimulation). Units are sorted along the y-axis of each bidimensional plot according to the direction of modulation, from stimulus-induced decrease (bottom) to increase (top) of the firing rate. D, E, Mean firing rates (spike density functions) across all putative interneurons (D) and pyramidal neurons (E) at each of the four recording sites. In the first 500 ms following nociceptive stimulation, mean firing rates were larger in S1 than in M1, and were larger in contralateral S1 than in ipsilateral S1. In contrast, firing rates of pyramidal neurons were not different. Statistical results are summarized in Extended Data Figure 5-1. *p < 0.05. Error bars represent SEM.

