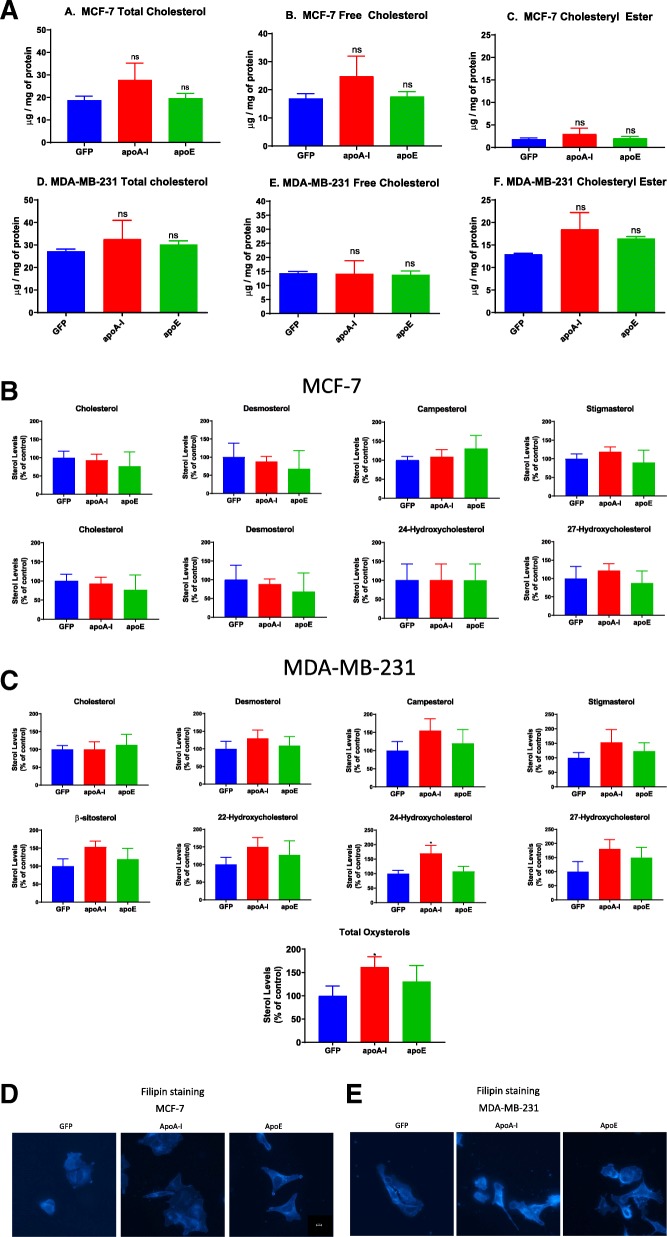
Fig. 3.
ApoA-I and apoE expression alter cholesterol metabolism in transfected MCF-7 and MDA-MB-231 cells. a Measurement of cellular cholesterol content (total, free, esterified) by HPTLC in transfected MCF-7 and MDA-MB-231 cells. Values represent means ± SD. ns, difference with control not significant. Significant difference compared to control cells: *P < 0.05. Measurement of sterol content by gas chromatography (GC) in transfected MCF-7 (b) and MDA-MB-231 (c) cells . After lipid extraction and saponification of the cellular extracts, cholesterol, desmosterol, 27-hydroxycholesterol, 22-hydroxycholesterol, 24-hydroxycholesterol, 27-hydroxycholesterol, beta-sitosterol, campesterol, and stigmasterol were quantified by GC. Values are means (± SD). Significant difference compared to control cells: *P < 0.05. d, e Visualization of free cholesterol by filipin staining in transfected MCF-7 and MDA-MB-231 cells. Free cholesterol was detected by fluorescence microscopy (DAPI channel) after cell incubation with filipin

