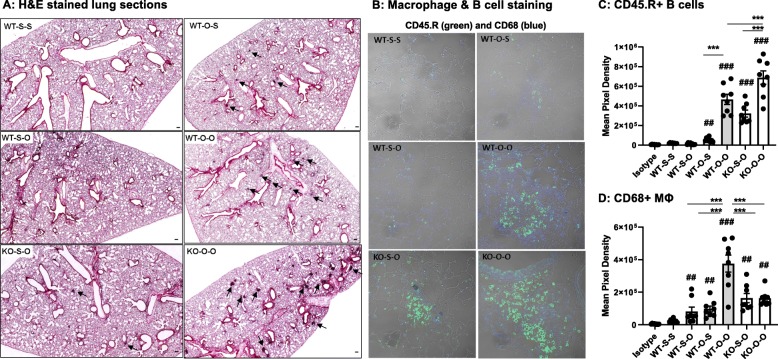
Fig. 8.
Lung histopathology accentuated with rechallenge following a 4 week recovery after repetitive ODE exposure. WT and MyD88 KO mice were repetitively exposed to saline or ODE for 3 weeks followed by a 4 week rest/recovery phase and then subsequently re-challenge once with saline or ODE. Panel a, Lung sections (5 μm) were H&E stained with representative images shown from each group of 4 animals/group (scale denotes 100 μm; 2x magnification). Arrows denote lymphocytic aggregates. Panel b, Confocal images of lung tissues stained for B cells (CD45.R; green) and macrophages (CD68; blue) shown at 40x magnification with selected images focused on aggregates where available. Scatter dot plots demonstrate mean with standard error bars of mean pixel density representing two regions of interest (ROIs) from each mouse (N = 8 ROI/group) depicting CD45.R+ B cells c and CD68+ Macrophages d. Treatment groups denoted as S-S (saline repeated exposure-saline rechallenge), O-S (ODE repeated exposure-saline rechallenge), S-O (saline repeated exposure-ODE rechallenge), and O-O (ODE repeated exposure-ODE rechallenge). Statistical significance denoted as ##p < 0.01, ###p < 0.001 vs. WT-S-S; and **p < 0.01, ***p < 0.001 denoted between groups (line)

