
Figure 2. Box plots to show group differences in gray matter density.
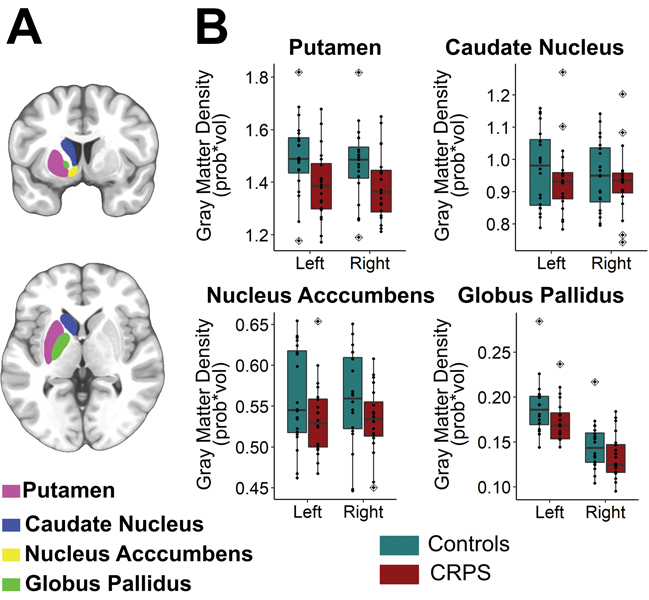
Out of all of the striatal ROIs analyzed (A), only the putamen showed a significant bilateral reduction in GMD in chronic CRPS patients when compared to healthy controls. Black dots indicate singe-subjects data. Outlier observations (e.g: outside 1.5 times the interquartile range above the upper quartile and bellow the lower quartile) are denoted with a rhombis symbol. Statistical results stemming from group x side repeated measures ANOVA are given in Table 3.