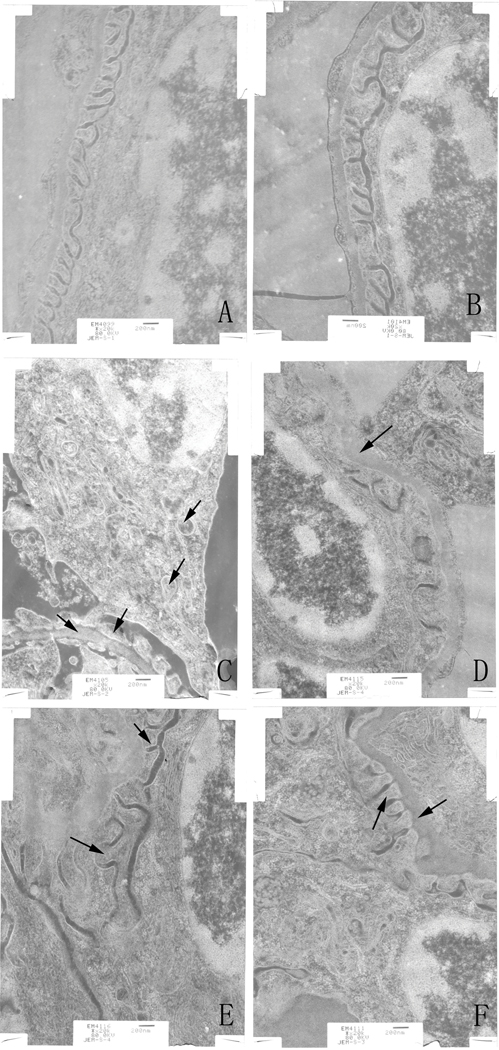
Figure 3.

Ultrastructure changes of renal tissue as monitored by transmission electron microscopy. (A) Control. (B) Solvent control. (C) TCE+, with basement membrane thickening, foot process fusions, swelling and vacuolar degeneration of mitochondria. (D) TCE-, with basement membrane thickening. (E) PDTC+, basement membrane thickening, foot process fusions. (F) PDTC-, with basement membrane thickening, foot process fusions. Black arrows indicate podo-cytes and mitochondrial vacuolar degeneration, and glomerular basement membrane thickening. Changes noted in (C) were alleviated in (E). Magnification = 20,000X.
