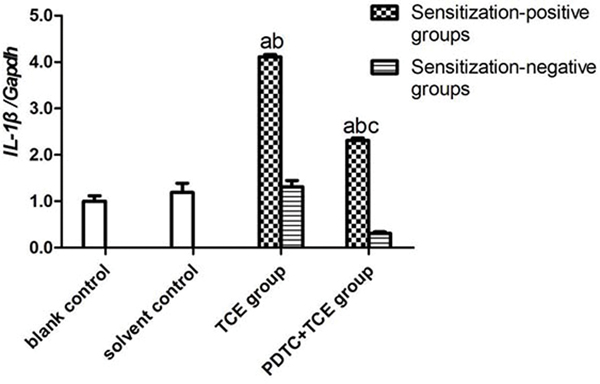
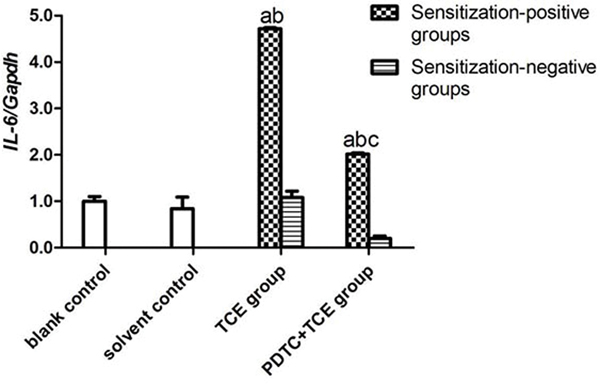
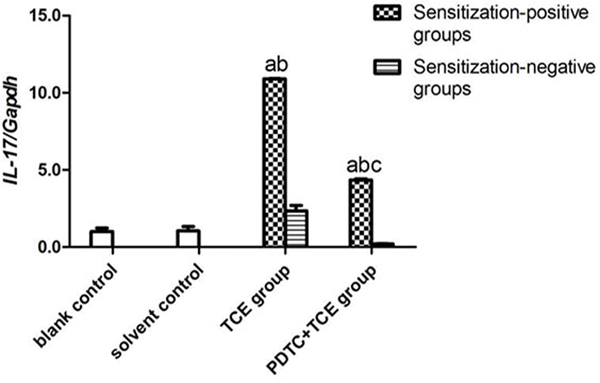
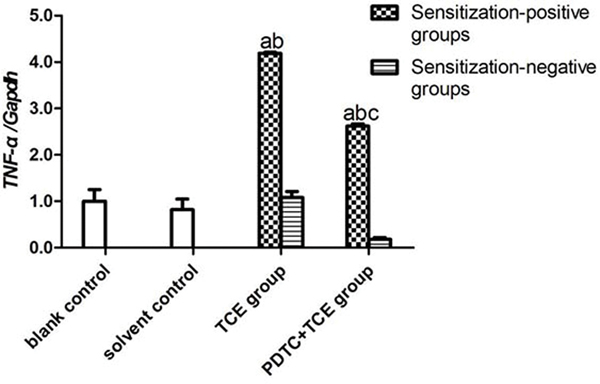
Figure 8.
IL-1β, IL-6, IL-17, and TNFα gene expression in kidney. Expression levels were normalized against GAPDH. (A) IL-1β. (B) IL-6 (C) IL-17 (D) TNFα. Data shown are means ± SD. Value significantly different vs. asolvent control, bcorresponding sensitization-negative group, or vs. c corresponding sensitization-positive group (each p < 0.05).


