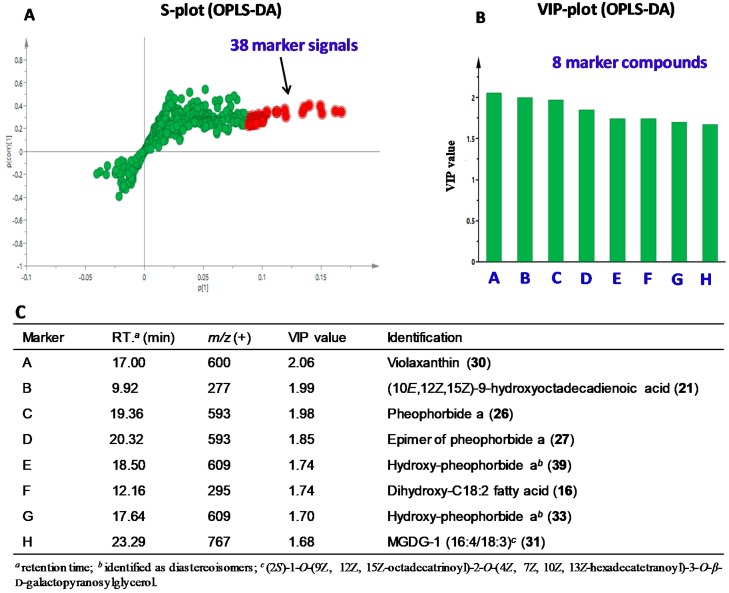
Figure 2.
Prediction of anti-inflammatory marker compounds by chemometrics: (A) OPLS-DA S-plot of chromatographic signals of 21 column fractions generated from the positive ESI-MS with 38 marker signals (VIP > 1.5) highlighted in red; (B) VIP plot showing 8 marker compounds corresponding to 38 marker signals; and (C) chromatographic and MS information of the 8 marker compounds.

