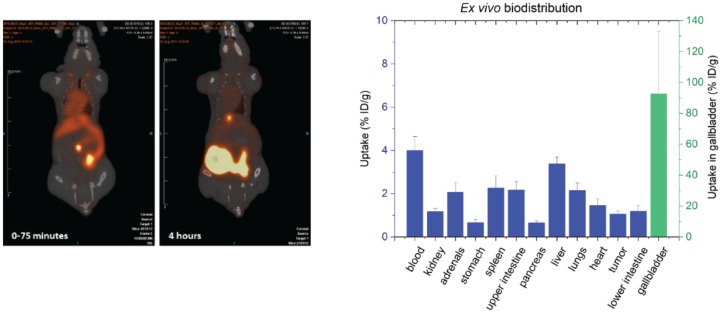
Figure 4.
(left) PET/CT images (coronal plane) of one of the tumor-bearing mice (mouse no. 1) receiving [45Ti]Salan-Ti-CA-PSMA ([45Ti]-3). Mouse no. 1 was dynamically scanned 0–75 min (left) and four hours (right) post-injection (p.i.); (right) The ex vivo biodistribution 4 h p.i. shown as the uptake of 45Ti in the percentage of injected dose per weight of tissue. The values were an average for the four mice, and the error bars represent the standard deviation. The uptake in the gallbladder (green) can be read off the right y-axis.

